
Der Anstieg der CO₂-Konzentration ist nicht die Ursache für den Temperaturanstieg, sondern eine Folge davon.
Ein unabhängiger Forscher (Robbins, 2025) hat aktuelle Forschungsergebnisse ausgewertet, die darauf hindeuten, dass mindestens „80 % oder mehr des Anstiegs [des modernen CO₂] natürlichen Ursprungs sind”.
Der Grund dafür ist, dass „Veränderungen der atmosphärischen Temperatur eine ‚Folge’ von Veränderungen der Meerestemperaturen sind und nicht, wie manche behaupten, deren ‚Ursache’”.
Quelle: Robbins, 2025
Inhalte:
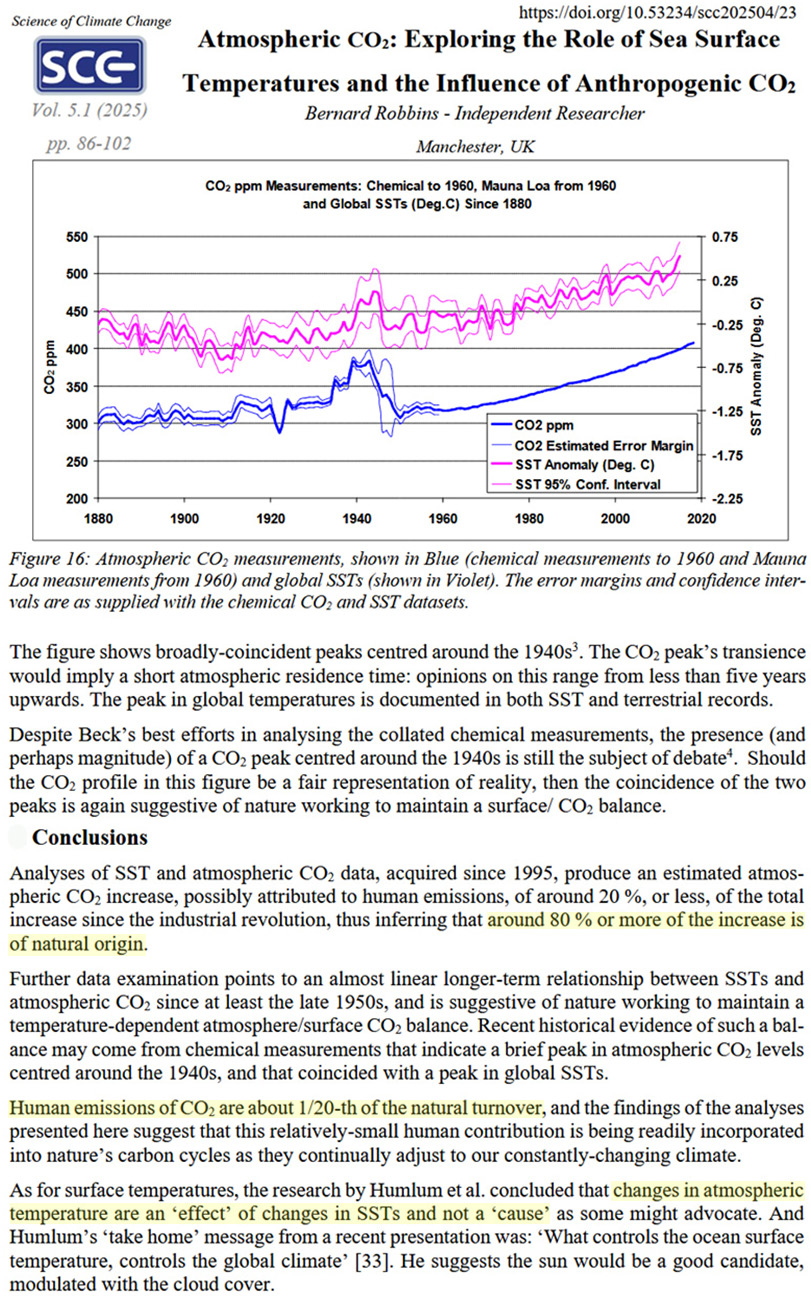
Atmosphärisches CO₂: Untersuchung der Rolle der Meerestemperaturen und des Einflusses von anthropogenem CO₂
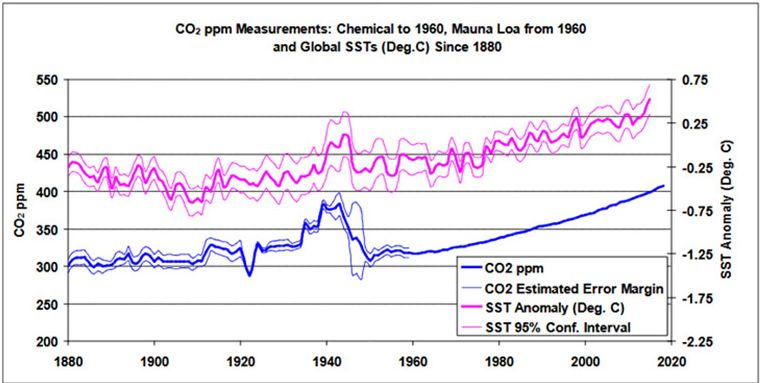
Abbildung 16: Messungen des atmosphärischen CO₂ in Blau (chemische Messungen bis 1960 und Mauna Loa-Messungen ab 1960) und globale SSTs (in Violett). Die Fehlermargen und Konfidenzintervalle entsprechen denen der chemischen CO₂- und SST-Datensätze.
Die Abbildung zeigt weitgehend übereinstimmende Spitzenwerte, die sich um die 1940er Jahre konzentrieren. Die Vergänglichkeit des CO₂-Spitzenwerts würde eine kurze Verweildauer in der Atmosphäre bedeuten: Die Meinungen hierzu reichen von weniger als fünf Jahren bis zu mehr als fünf Jahren. Der Spitzenwert der globalen Temperaturen ist sowohl in den SST- als auch in den terrestrischen Aufzeichnungen dokumentiert.
Trotz Becks größter Bemühungen bei der Analyse der zusammengetragenen chemischen Messungen ist das Vorhandensein (und möglicherweise auch das Ausmaß) eines CO₂-Peaks um die 1940er Jahre herum nach wie vor umstritten. Sollte das CO₂-Profil in dieser Abbildung die Realität angemessen wiedergeben, dann deutet die Übereinstimmung der beiden Peaks erneut darauf hin, dass die Natur daran arbeitet, ein Gleichgewicht zwischen Oberfläche und CO₂ aufrechtzuerhalten.
Bernard Robbins: Sea Surface Temperatures and Recent Increases in Atmospheric CO₂, Science of Climate Change https://scienceofclimatechange.org
Schlussfolgerungen
Analysen der seit 1995 erfassten Daten zu Meerestemperaturen (SST) und atmosphärischem CO₂ ergeben einen geschätzten Anstieg des atmosphärischen CO₂ um etwa 20 % oder weniger des Gesamtanstiegs seit der industriellen Revolution, der möglicherweise auf menschliche Emissionen zurückzuführen ist. Daraus lässt sich schließen, dass etwa 80 % oder mehr des Anstiegs natürlichen Ursprungs sind.
Weitere Datenauswertungen deuten auf einen fast linearen langfristigen Zusammenhang zwischen SST und atmosphärischem CO₂ seit mindestens Ende der 1950er Jahre hin und lassen vermuten, dass die Natur daran arbeitet, ein temperaturabhängiges Gleichgewicht zwischen Atmosphäre und Oberflächen-CO₂ aufrechtzuerhalten. Aktuelle historische Belege für ein solches Gleichgewicht könnten chemische Messungen liefern, die auf einen kurzen Anstieg der CO₂-Konzentration in der Atmosphäre um die 1940er Jahre hinweisen, der mit einem Anstieg der globalen SSTs zusammenfiel.
Die vom Menschen verursachten CO₂-Emissionen machen etwa 1/20 des natürlichen Umsatzes aus, und die Ergebnisse der hier vorgestellten Analysen deuten darauf hin, dass dieser relativ geringe Beitrag des Menschen leicht in die Kohlenstoffkreisläufe der Natur integriert wird, passen sich diese doch kontinuierlich an unser sich ständig veränderndes Klima an.
Was die Temperaturen betrifft, so kam die Forschung von Humlum et al. zu dem Schluss, dass Veränderungen der atmosphärischen Temperatur eine „Auswirkung” von Veränderungen der Meerestemperaturen sind und nicht, wie manche behaupten, deren „Ursache”. Und Humlums Kernaussage aus einem kürzlich gehaltenen Vortrag lautete: „Was die Meerestemperatur steuert, steuert auch das globale Klima” [33]. Er schlägt vor, dass die Sonne ein guter Kandidat wäre, moduliert durch die Wolkendecke.
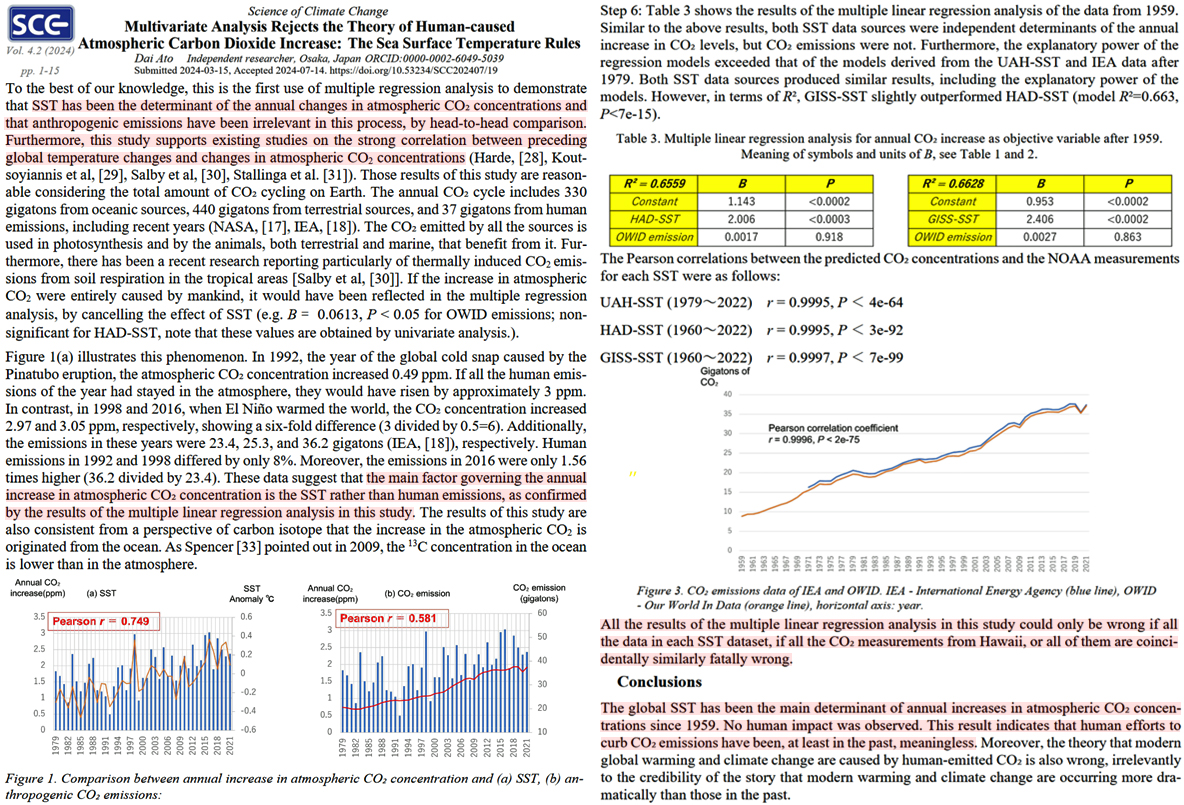
Ähnliche Schlussfolgerungen finden sich in einem Artikel, der letztes Jahr in der gleichen Fachzeitschrift veröffentlicht worden ist. (Ato, 2024).
„Die Meerestemperatur (SST) war der entscheidende Faktor für die jährlichen Veränderungen der CO₂-Konzentrationen in der Atmosphäre, und […] anthropogene Emissionen spielten in diesem Prozess keine Rolle …“
Quelle: Ato, 2024
Quelle: Ato, 2024
Übersetzt von Christian Freuer für das EIKE


Wir freuen uns über Ihren Kommentar, bitten aber folgende Regeln zu beachten:
- Bitte geben Sie Ihren Namen an (Benutzerprofil) - Kommentare "von anonym" werden gelöscht.
- Vermeiden Sie Allgemeinplätze, Beleidigungen oder Fäkal- Sprache, es sei denn, dass sie in einem notwendigen Zitat enthalten oder für die Anmerkung wichtig sind. Vermeiden Sie Schmähreden, andauernde Wiederholungen und jede Form von Mißachtung von Gegnern. Auch lange Präsentationen von Amateur-Theorien bitten wir zu vermeiden.
- Bleiben Sie beim Thema des zu kommentierenden Beitrags. Gehen Sie in Diskussionen mit Bloggern anderer Meinung auf deren Argumente ein und weichen Sie nicht durch Eröffnen laufend neuer Themen aus. Beschränken Sie sich auf eine zumutbare Anzahl von Kommentaren pro Zeit. Versuchte Majorisierung unseres Kommentarblogs, wie z.B. durch extrem häufiges Posten, permanente Wiederholungen etc. (Forentrolle) wird von uns mit Sperren beantwortet.
- Sie können anderer Meinung sein, aber vermeiden Sie persönliche Angriffe.
- Drohungen werden ernst genommen und ggf. an die Strafverfolgungsbehörden weitergegeben.
- Spam und Werbung sind im Kommentarbereich nicht erlaubt.
Diese Richtlinien sind sehr allgemein und können nicht jede mögliche Situation abdecken. Nehmen Sie deshalb bitte nicht an, dass das EIKE Management mit Ihnen übereinstimmt oder sonst Ihre Anmerkungen gutheißt. Wir behalten uns jederzeit das Recht vor, Anmerkungen zu filtern oder zu löschen oder zu bestreiten und dies ganz allein nach unserem Gutdünken. Wenn Sie finden, dass Ihre Anmerkung unpassend gefiltert wurde, schicken Sie uns bitte eine Mail über "Über Uns->Kontakt"Erdmagnetfeld beeinflusst KlimaMeerwasser nimmt bei schwächerem Magnetfeld weniger CO2 aufhttps://www.scinexx.de/news/geowissen/erdmagnetfeld-beeinflusst-klima/
Der CO₂-Anstieg in der Luft ist menschengemacht.
.
Die Mengen an zusätzlicher CO₂ Freisetzung durch die Verbrennung von Kohle, Erdgas und Erdöl sind doch bekannt und das treibt die ppm CO₂ in der umgebenden Luftschicht nach oben.
.
.
Die Folge ist der menschengemachte Klimawandel, es wird wärmer auf der Welt.
.
Erde kühlt schneller ab als gedacht
Messung zeigt höhere Wärmeleitfähigkeit für Mineral der Kern-Mantel-Grenze
Schleichender Wärmeverlust: Aus dem heißen Erdkern dringt mehr Wärme nach außen als gedacht – als Folge kühlt unser Planet schneller aus. Indizien dafür liefert die Wärmeleitfähigkeit des an der Kern-Mantel-Grenze dominierenden Minerals Bridgmanit.
Neuen Messungen zufolge liegt sie 1,5-Mal höher als bislang angenommen, weswegen das Mineral mehr Wärme aus dem Erdkern in den Erdmantel dringen lässt.
https://www.scinexx.de/news/geowissen/erde-kuehlt-schneller-ab-als-gedacht/
Da wird wohl nichts wesentlich wärmer Herr Kraus.
Schon seit ungefähr 3 Millionen Jahren wird es im Durchschnitt kälter.
Zur Info zu diesem Thema mein Kommentar an EPA:
Comment to ”A Critical Review of Impacts of Greenhouse Gas Emissions on the U.S. Climate”
Excellent review, but incomplete
The review of the CWG is excellent and it provides well-founded criticism on the prevailing climate narrative, expressed in factual language and supported by detailed evidence. All objections appear to be justified. However, regarding an important point in the climate debate, the origin of the high concentration of CO2 in the atmosphere, the report fails to raise critical questions, even though they might be particularly necessary. Formulations like
· “… some portion of the additional CO2 persists in the atmosphere for centuries” (Executive Summary, p. IX)
· “… land and ocean processes currently absorb “excess” CO2 at a rate of approximately 50 percent of the human emissions” (section 3.1.2, p. 14)
· “Carbon dioxide emissions from fossil fuel burning … have led to steadily increasing CO2 concentrations in the atmosphere” (section 3.2.2, p. 17)
· “… the more CO2 humanity has produced, the faster nature removed it from the atmosphere” (section 3.2.2, p. 18)
appear to rest on the widely held assumption that the increase in the atmospheric CO2 concentration is caused by half of the anthropogenic emissions remaining in the atmosphere long-term. Unfortunately, this assumption is not questioned in the report, despite strong indications that it may be false. If this proves to be the case, the consequences will be far reaching. Therefore, several arguments against a retention rate of 50 % for anthropogenic emissions will be discussed below:
Identical molecules
Since all CO2 molecules are identical and the atmosphere is well mixed, they must behave the same way regardless of source. If 50 % of anthropogenic molecules were to remain in the atmosphere, then 50 % of natural molecules would have to remain as well. This is clearly not the case. Therefore, the 50 % retention rate is unlikely to apply to anthropogenic emissions either.
Carbon Cycle
However, the atmosphere is not an isolated reservoir but part of a broader cycle. Could this explain why 50 % of anthropogenic CO2 might remain in the atmosphere? At least theoretically yes, there are even two possible scenarios to do this, but neither of them seems to exist on the real Earth:
Scenario 1: Closed System
This scenario assumes that the atmosphere and its exchange partners form a closed system. In such a system, all CO2 molecules imported from the outside, for example by burning fossil fuels, would distribute evenly (same partial pressure everywhere, Second Law of Thermodynamics, entropy increase). And if, in addition, the carbon inventory in the atmosphere were the same size as that in the rest of the system, then 50 % of the CO2 molecules imported would remain in the atmosphere, with the other 50 % anywhere else in the rest of the system. However, in reality, the size ratio is far from balanced. The ocean alone holds much more than an order of magnitude more carbon than the atmosphere. Therefore, not half of the carbon imported from the outside remains in the atmosphere, rather most of it accumulates in the ocean.
But perhaps there could be a way to resolve this issue: By splitting the carbon cycle into a fast part and a slow part. If in the fast part the inventories were balanced, 50 % would indeed remain in the atmosphere, even if only temporary, but that could be long enough for the ongoing discussions about the climate. The obvious partition for that purpose is to take the atmosphere together with the near-surface mixed layer in the ocean and with short-lived terrestrial biomass (annual plants, leaves, and the like) as the fast part (“fast cycle”), leaving the deep ocean and the long-lived terrestrial biomass for the slow part (“slow cycle”). In this “fast cycle”, the exchange rates are very high, and all reservoirs in it have relatively small carbon inventories, so that this cycle always runs close to equilibrium, and it is this “fast cycle” as a whole that then interacts with the deep ocean and the long-lived terrestrial biomass in the “slow cycle”, with much lower exchange rates.
However, even in this “fast cycle”, the carbon inventory in the atmosphere very probably is much smaller than that in the rest of that cycle. Thus, this approach does not appear to work either. But even if it were possible to find a division into “fast” and “slow” with balanced inventories in the “fast cycle”, this “fast cycle” would in any case be an open system with an outflow into the “slow cycle”. And 50 % retention never works in an open system. This is, because in such a system, a constant inflow always leads to equilibrium, not retention. Splitting the carbon cycle merely shifts the problem of the closed system from the atmosphere with all its exchange partners to the “fast cycle” with only the fast exchange partners, without solving it. The “fast cycle” never is a closed system. Thus, scenario 1 should be ruled out altogether.
Scenario 2: A water well as a model
The second theoretically possible scenario for retention of 50 % assumes that CO2 in the atmosphere behaves like water in a special well: A well with basin and fountain, where the fountain is fed from the basin via a pump and the water level in the basin is regulated via an overflow. In this model, the two processes “circulation to the fountain”, and ”regulation of the water level in the basin”, run completely independently of each other. The circulation via the fountain always feeds back the same amount of water as it extracts, it therefore has no influence on the water level. And that level does not influence the circulation via the fountain, because that circulation is determined solely by the power of the pump and it runs in a closed loop with the same flow rate everywhere. If the inflow from the outside into the basin is kept constant, the level in it adjusts so that it balances inflow and outflow (overflow). And if the inflow rises, the outflow rises too, and so does the water volume in the basin. And whenever the inflow rises exponentially, the water volume in the basin rises by a fixed proportion of the inflow. How large this proportion is, depends on the gradient of the rise and on the specific design of the overflow. In some cases, it could even be 50 %, but these 50 % would not be a law, it only would be by chance.
Consciously or unconsciously, this model probably is the basis for the widespread assumption that the increase in atmospheric concentration is caused by retaining 50 % of the anthropogenic emissions. If it is assumed that the natural circulation through the atmosphere has remained constant (like constant circulation via the fountain in the well), and if the concentration has increased corresponding to half of the anthropogenic emissions, then it seems obvious that half of these emissions remain in the atmosphere, increasing the concentration. But this explanation is based on the said model. Within this model, everything fits together. But this model does not fit the atmosphere. All statements obtained using this model therefore lack justification.
A better model
Let’s check another model: Again, a well with a fountain, but this time with the water level in the basin being regulated via holes in the bottom instead of an overflow, with the outflow through these holes going into a large lake, and with the fountain being fed by water from that lake rather than from the basin.
This model seems to fit quite well to the atmosphere: In both cases, in the model and in the real atmosphere, the two processes “circulation” and “regulation” interact, because both depend on the outflow (of water from the basin, respectively of CO2 from the atmosphere). In both cases, the outflow always goes into the same sinks, it scales for all sinks not with the excess above a predetermined threshold value, but with the total inventory (water level above bottom, respectively total concentration), and it does not depend on the simultaneous inflow (of water, respectively of CO2 molecules), certainly not on the inflow from a specific source (anthropogenic emissions). And regarding the circulation, there is no closed loop with identical inflow and outflow, neither in the well nor in the atmosphere. In both cases, the circulation can be imbalanced (what then influences the water level, respectively the concentration), and the circulation generally scales with the water level, respectively with the concentration, because the outflow scales with these variables.
The agreement between the model and the real atmosphere is therefore actually very good. However, there is also a difference: In the well, the outflow from the basin is the flow of a fluid and as such it scales with the square root of the water level (Torricelli’s law), whereas the outflow of CO2 from the atmosphere is accomplished by diffusion and as such it scales directly with the concentration, not with its square root (Henry’s low, Fick’s laws). But this merely affects quantitative details, not the principle. This principle is correctly described in the new model, but is completely misrepresented in the old one.
Therefore, the situation seems to be fairly clear: This second scenario for a retention rate of 50 % is based on an inappropriate model, which differs from the atmosphere in crucial features. A better model leads to completely different results. As a consequence, the second scenario should be ruled out altogether too.
2.5 %, not 50 %
As long as no physical process can be identified that systematically retains 50 % of the anthropogenic emissions in the atmosphere, it is extremely unlikely that this retention rate accurately describes the true conditions in the atmosphere. “50 % retention” is a mathematical calculation combining two values that are not physically linked to each other: What accumulates in the atmosphere is the difference between the total outflow and the total inflow, not between the total outflow and the inflow from just a single source. Therefore, this “50 % retention” has no physical significance. An explanation with physical significance is that 2.5 % of all CO2 molecules emitted in the atmosphere remain in it. And inevitably, all sources of emission contribute to this retention, each one proportional to its strength, not just a single one. (For clarification: It is not individual molecules; 100 % is the total amount of CO2 that flows into the atmosphere within one year; an amount corresponding to 2.5 % of that quantity accumulates in the atmosphere, and an amount corresponding to 97.5 % of that quantity flows out).
Increase in natural emissions outweighs human emissions
As already said, the outflow of CO2 from the atmosphere occurs mainly through diffusion processes, which generally increase with concentration. At least in the relevant range from 280 to 420 ppm, this correlation should be proportionality, at least approximated. If this holds, then the outflow, which had been 80 ppm/year in the preindustrial equilibrium at 280 ppm, must have increased to 120 ppm/year at today’s 420 ppm (approximated values). And since the concentration has increased, the emissions into the atmosphere must have increased even more. Anthropogenic emissions of only 5 ppm/year are far too low to account for this. The lion’s share must therefore come from strongly increased natural sources; there appears to be no other plausible explanation. This is checked in two ways:
Check 1: Systemic perspective
What we really know is only the concentration and its change over time, only this is measured. Everything else we just can calculate from this basic information. That also applies to the size of inflow and outflow. Of course, for the concentration to increase, the inflow must have increased, and conversely, any increased concentration necessarily means that the inflow has increased. By how much it has increased, is determined by the fact that the system is an open system with outflow increasing with concentration. In such a system, whenever the inflow into it is kept constant, the concentration adjusts to an equilibrium. Therefore, in such a system, the concentration can never increase more than the inflow into it. Applied to the atmosphere: For the concentration to have increased by 50 %, the inflow must have increased by at least 50 % (50 % in equilibrium). This always holds, whenever the outflow increases with concentration, independent of the exact form of this correlation.
But that exact form is important for the outflow: Whenever the concentration rises, the outflow rises too. And as already said, because of diffusion processes, the exact form should be proportionality, or at least close to it. And since the concentration has risen, the inflow must have risen even more. Therefore, the inflow must have risen by approx. 50 %, otherwise the high concentration could not have been achieved at all.
Regardless of whether one looks at the inflow or at the outflow, in both cases the increased and growing concentration appears to require significantly higher emissions from natural sources. These sources have contributed far more to the increase in concentration than anthropogenic emissions.
Check 2: IPCC numbers
A further check can be performed by comparing the results found here with numbers given by IPCC: IPCC does not calculate by simple proportionality, but with very sophisticated climate models that consider a lot of possible influences and interrelationships, and that only run on large supercomputers. The results are summarized in Fig. 5.12 of AR 6: Before the industrial revolution, outflow and inflow of CO2 from/to the atmosphere have been balanced at 81.4 ppm/year (2.13 GtC = 1 ppm) at a concentration of 276 ppm, and since that the outflow has increased by 17.7 ppm/year, and the inflow has increased by 24.9 ppm/year, the latter including 5.15 ppm/year anthropogenic emissions, at the new concentration of 409 ppm. That’s not exactly proportionality, but not so far from it. The important point is that, according to the numbers of IPCC, emissions from natural sources have increased much more than those from anthropogenic sources. Natural sources are the main driver for increased concentration. IPCC’s numbers confirm the findings here, only in its wording IPCC tells something different. But that’s another story.
In summary: Both checks lead to the same result: natural sources appear to have increased far more than anthropogenic ones.
Summary and consequences
All considerations made here consistently indicate that the increase in atmospheric CO2 concentration most likely is mainly a natural process with only minor human contributions. If this is confirmed, it has far reaching consequences: There are only two possibilities left. Either climate change is driven by naturally emitted CO2, or it is driven by other influencing factors, whatever they may be. In both cases, it is not emissions from the use of fossil fuels. Therefore, reducing these emissions makes no sense. Rather, humanity can benefit from increased energy availability. Viewed objectively, future climate changes will come or not, whatever we do. We have no choice but to prepare for possible consequences. Where prevention is not feasible, adaptation is the better choice.
Discussion
Most arguments presented here follow logical reasoning. Of course, all of them have to be checked carefully. The guiding principle for this is the laws of logic, and the result is either “correct” or “wrong”. Let’s wait and see which one it will be.
Something similar also applies to the question, whether the outflow of CO2 from the atmosphere depends on anthropogenic emissions or on concentration, except that this is more a question of physics than of logic. But whatever discipline, if it should be “anthropogenic emissions”, then most of the conclusions drawn here would break down. However, as already shown, it very probably is the other way around: Most likely, the outflow depends on concentration. Therefore, the only thing that is really open is how close to proportionality this dependency is, and that seems to be subject to expert judgment.
We don’t know the exact value yet, but the figures elaborated in this comment show a margin of about one order of magnitude until anthropogenic emissions alone could explain the actual development of the atmosphere, if they can at all. It is extremely unlikely that this large margin will not be sufficient to keep the conclusion “primarily natural sources” valid. The predominance of these sources may be somewhat smaller, but it very likely will not vanish. And of course, it makes no sense to reduce insignificant contributions. The benefits for humanity of using more energy seem to far outweigh any potential harm, even if it is fossil fuels releasing CO2. This always applies, even if CO2 had a strong influence on the climate.
Clarifying the origin of the CO2 in the atmosphere is one of the most important issues in the entire climate debate. It also determines the urgency of many other discussion points. It is therefore all the more unfortunate that the CWG report does not address this matter. This omission should be rectified as soon as possible.
Literature for further information
· Berry, E. X. (2019). Human CO2-Emissions Have Little Effect on Atmospheric CO2, International Journal of Atmospheric and Oceanic Sciences, Vol. 3, No. 1, 2019, pp. 13-26; https://doi.org/10.11648/j.ijaos.20190301.13
· Gork 3 beta et al. (2025). A Critical Reassessment of the Anthropogenic CO₂-Global Warming Hypothesis: Empirical Evidence Contradicts IPCC Models and Solar Forcing Assumptions. Science of Climate Change, Vol. 5.1 (2025), pp. 1-16, https://doi.org/10.53234/SCC202501/06
· Harde, H. (2017). Scrutinizing the carbon cycle and CO2 residence time in the atmosphere. Global and Planetary Change 152, pp. 19–26, https://doi.org/10.1016/j.gloplacha.2017.02.009
· Harde, H. (2019). What Humans Contribute to Atmospheric CO2: Comparison of Carbon Cycle Models with Observations, Earth Sciences, Vol. 8, No. 3, 2019, pp. 139-159, https://doi.org/10.11648/j.earth.20190803.13
· Harde, H. (2023). Understanding Increasing Atmospheric CO2, Science of Climate Change, Vol. 3.1 (2023), pp. 46-67, https://doi.org/10.53234/scc202301/23
· Harde, H., & Salby, M. (2021). What Controls the Atmospheric CO2-Level?, Science of Climate Change, Vol. 1, No. 1, August 30, 2021, pp. 54-69, https://doi.org/10.53234/scc202106/22
· Koutsoyiannis, D., et al. (2023). On Hens, Eggs, Temperatures and CO2: Causal Links in Earth’s Atmosphere, Sci 2023, 5, 35. https://doi.org/10.3390/sci5030035
· Koutsoyiannis, D. (2024). Refined Reservoir Routing (RRR) and its Application to Atmospheric Carbo Dioxide Balance, Water 2024, 16(17), 2402; https://doi.org/10.3390/w16172402
· Salby, M. (2018). What is Really Behind the Increase of Atmospheric CO2?, Lecture at Helmut Schmidt Universität, Hamburg, 10.10.2018, https://youtu.be/b1cGqL9y548?feature=shared
· Roth, E. (2019). Probleme beim Klimaproblem – Ein Mythos zerbricht, BoD-Verlag Norderstedt 2019, ISBN 978-3-7481-8275-7, E-Book 978-3-7494-0328-8
· Roth, E. (2023). Climate: Man or Nature? A Contribution to the Discussion. Science of Climate Change, Vol. 3.5 (2023), pp. 521-542, https://doi.org/10.53234/scc202310/40
· Roth, E. (2024). The Physics of the Carbon Cycle: About the Origin of CO2 in the Atmosphere. Physical Science International Journal 28 (5): 109-24, https://doi.org/10.9734/psij/2024/v28i5853
· Roth, E. (2025). About the Origin of CO2 in the Atmosphere: Some Annotations to a Study of the CO2 Coalition. Science of Climate Change, Vol. 5.1 (2025), pp. 1-14, https://doi.org/10.53234/scc202501/05
· Roth, E. (2025). A Novel Model to Assess the Earth’s Greenhouse Effect. American Journal of Sciences and Engineering Research, E-ISSN– 2348–703X, Volume 8, Issue 4, 2025, pp. 98-107.
Ich finde es interessant das weiter zu untersuchen.
Schließlich ist das ja auch eine interessante Rückkopplung in El Nino – Zeiträumen.
Aber wenn es den langfristigen Trend prägt, müsste dann der pH-Wert nicht steigen?
Beobachtet wird aber eine Abnahme.
Ja, es ist halt genau anders rum. Die Menschheit hat rund 1100GtC emittiert, in der Atmosphäre gab es einen Anstieg von 300GtC.
Wenn also 80% dieser 300GtC „natürlich“ wären, wohin verschwanden dann die übrigen 800 + 0,8*300 = 1040GtC???
Eigentlich zeigen die Zahlen, dass die CO2 Senken sehr gut und nachhaltig funktionieren. Weil die „Klimawissenschaft“ das Gegenteil behauptet, des Alarmismus wegen, stellt das auch einen der Knackpunkte eben jener Agenda dar.
Doch anstatt das berechtiger Weise zu diskutieren, kommt dann so ein Unsinn. Für die Klimaagenda sind solche Ablenkungen eher nützlich.
Herr Schaffer, Sie haben da etwas durcheinander gebracht. Die +300 GtC in der Atmosphäre sind 1100 GtCO2. Denken wir uns z.B. in Summe 40% Senkenfluss (der ja proportional zu ppm-280 ansteigt), hätten wir 500 GtC emittiert. Dass 80% unserer Emission (??) von der Natur kommen sollen, ist doch Unsinn. Woher soll die die Natur unsere Emission kennen und wie soll sie diesen proportionalen (!) Zuwachs erzeugen?? Vielleicht haben die Autoren mit dem 5fach zu hohen ECS von IPCC gerechnet, sind auf den realen Effekt von etwa nur etwa 20% gekommen und haben daraus fälschlich 80% Natur abgeleitet.
Ich bringe gar nichts durcheinander. Nochmal, wir haben rund 1100GtC emittiert, oder rund 4000Gt CO2.
Herr Schaffer, ich empfehle http://www.fachinfo.eu/dietze2020.pdf mit dem atmosphärischen C-Anstieg in Abb.2. Wenn Sie behaupten dass der Senkenfluss in GtC (1100-300)/1100=73% war, sind Sie auf dem Holzweg denn bisher sind allenfalls 40% realistisch. Jetzt sind wir bei etwa 63% und erst bei max. 500 ppm erreichen wir bei 11,3 GtC/a 100%.
Wozu? Steht ja nichts sinnvolles drin.
Ich glaube Sie haben keine Ahnung wie viel CO2 die Menschheit bereits emittiert hat. Da wären mal >500GtC aus der Nutzung fossiler Brennstoffe. Dann wären da nochmal 220GtC aus der Landnutzung seit 1850. Vorindustriell haben wir jedoch auch schon große Flächen entwaldet, macht nochmal ~330GtC. Dazu kommen noch kleinere Mengen durch Zement und der Oxidation von Methan..
Also eben 1050-1100GtC
Herr Schaffer, wenn nach Ihrer Meinung bisher der Senkenfluss 73% der Emission war, müssen wir doch Idioten sein wenn wir CO2 auf fast Null (!) reduzieren, 20 Millionen Wärmepumpen für 500 Mrd € kaufen und unsere Wirtschaft unnötig mit Kosten von 10 Billionen € für ein wenig Klimaschutz platt machen wollen. Seltsam dass Sie damit auch davon ausgehen dass sogar die Herren Professoren Vahrenholt und Ganteför nicht wissen dass wir in Wirklichkeit schon so viel mehr CO2 emittiert haben.
Ich habe nichts Gegenteiliges behauptet.
Zumindest Ganteför versteht den THE so wenig wie Sie. Inkompetenz ist weit verbreitet unter Klimaphysikern, so seltsam das auch ist. Dass es vorindustriell schon große Emissionen gab ist doch logisch, für jeden der selbstständig denken kann. Wenn man das nicht kann, und nicht zufällig davon hört, dann freilich wird einem dieser Umstand überraschen.
Allerdings wenn man Verstand besitzt und daher die richtigen Fragen stellt, sind die Antworten nicht so schwer zu finden..
https://www.realclimate.org/index.php/archives/2018/10/pre-industrial-anthropogenic-co2-emissions-how-large/
Herr Schaffer, da Sie schon von großen vorindustrieellen Emissionen sprechen, weise ich darauf hin dass dies ja keine fossilen Emissionen sind, sondern klimaneutrale wie Holzverbrennung, unsere Atmung, Verrottung vom Biomasse oder Entwaldung. Die Zählung der fossilen Verbrennung seit etwa 1840 erscheint mir daher eigentlich ziemlich korrekt. Auch die Emission durch Zement und Methan gehört doch dazu. Die Emissionen von Vulkanen und black smokers am Meeresgrund rechne ich zum langfristig in etwa ausgeglichenen Naturkreislauf.
Eben nicht „klimaneutral“. 2 – 2,5 mio km2 hat die Menschheit gerodet. Pro ha speichert Wald ungefähr 250tC – in Bäumen, Wurzelwerk und Boden. Wird der Wald gerodet landet dieser Kohlenstoff in der Atmosphäre, bzw. wird eben nicht mehr in diesem Wald gespeichert. Das macht dann 500 bis 625GtC, oder 1800 bis 2300Gt CO2. So ist die Theorie.
Ist diese Theorie korrekt, dann gab es eben vorindustriell schon gewaltige CO2 Emissionen. Dass diese die atmosphärische CO2 Konzentration kaum nachhaltig beeinflussen konnten, stellt allerdings das Senkenmodell in Frage.
Sollte die Theorie falsch sein, in dem Sinne, dass die Entwaldung wenig oder kaum CO2 freigesetzt hätte, dann würden die CO2 Senken, wenn auch auf niedrigerem Niveau, perfekt mit der atmosphärischen CO2 Konzentration skalieren. Auch dann würde das Senkenmodell widerlegt.
Herr Schaffer, wozu dietze2020 pdf? Da steht nichts sinnvolles drin?? Leider haben Sie übersehen dass in Abb.2 als Beispiel der Verlauf des ppm-Anstiegs für eine konstante Gesamtemission E von 7 GtC ab 1948 gezeigt wird. Für die airborne fraction gilt f=0,75•exp(-t/T), und da der Senkenfluss E•(1-exp(-t/T)) ist, kann man das leicht berechnen, von 1948 bis heute integrieren und durch die gesamte Emission dividieren. Dann können Sie mit Ihrem Wert von 73% vergleichen. Der Senkenfluss ist sogar an der rechten Ordinate angegeben.
Einfache Antwort Herr Schaffer,
Umso mehr CO², desto mehr ergrünt die Erde und umso mehr CO² wird von den besser wachsenden Pflanzen absorbiert.
https://www.nzz.ch/wissenschaft/klima/die-erde-ergruent-ld.16586
Zu Zeit der Dinos war es 8 bis 14°C wärmer als heute und Dinos wurden so riesig weil es genug zu fressen gab.
https://www.scinexx.de/news/biowissen/dino-dinner-futter-gabs-genug/
Optimum bei 1.200 ppm CO2
Das Ergebnis: Entgegen den Erwartungen nahm der Nährstoff- und Energiegehalte von mehreren der getesteten Pflanzenarten auch bei hohen CO2-Werten nicht ab. Der Schachtelhalm blieb sogar unabhängig von den CO2-Werten gleich gehaltvoll, beim Farn, dem Ginkgo, der Araukarie und dem Hahnenfuß war der Nährstoffgehalt bei 1.200 ppm CO am höchsten. Nur der Mammutbaum verlor oberhalb von 800 ppm deutlich an Energiegehalt.
(Nota: aktuell sind wir nur bei 430 PPM)
„Unsere Ergebnisse widersprechen gängigen Annahmen einer konstanten und linearen Abnahme des Nährstoffgehalts von Nahrungspflanzen bei steigenden CO2-Werten“, konstatieren Gill und ihre Kollegen. Demnach war das Futter der pflanzenfressenden Sauropoden vor rund 150 Millionen Jahren im Schnitt nicht weniger gehaltvoll als es verwandten Pflanzen heute sind – trotz vermutlich doppelter CO2-Werte.“
—-
Ausser den Raptoren, Tyrannosaurus und anderen Raubsauriern war es wohl ein Paradies.
Der Anstieg der CO₂-Konzentration ist nicht die Ursache für den Temperaturanstieg, sondern eine Folge davon, steht im Artikel.
Das haben wir als Merksatz bereits in veränderter Form 1966 im Gymnasium gelernt: Wärmeres Wasser läßt CO2 ausgasen.
Nur die CO2-Glaubenskirche verdreht die wissenschaftliche Wahrheit, und das ganz bewußt. Die wollen uns weiter ausplündern und von den CO2-Steuern leben.
Aber damit entsteht die wissenschaftliche Frage: Weshalb wurden die Meere wärmer? Um Helgoland herum übrigens auch seit 1988 bis heute.
Herr Kowatsch, „Der Anstieg der CO₂-Konzentration ist nicht die Ursache für den Temperaturanstieg, sondern eine Folge davon, steht im Artikel“ zeigt dass auch Sie den THE mit ECS und Gegenstahlung immer noch nicht verstanden haben und die Eiszeit mit der Jetztzeit verwechseln.
Mit diesem Unsinn versuchen Sie, alle wiss. Aufklärungsarbeit gegen die Dekarbonisierung durch Modellrechnungen mit dem sehr geringen CO2-Effekt obsolet zu machen. Damit suggerieren Sie doch dass die soliden Fachleute blöd sind, und so werden Sie und wir von Klimaschützern sowie von Energiepolitikern, die Billionenschaden anrichten, als irrelevante Spinner ignoriert.
Sie werden es nie verstehen, der Klimatismus ist Politik, und Ihre „soliden Fachleute“ dienen sich dieser an, ganz vorn dabei das PIK, welches schon beides ist, dienende Pseudowissenschaft und politisches Propagandainstitut, heute am 5.9.25, in der „Welt“ nachzulesen, oder?
Herr Lange, die Leute vom PIK sind doch KEINE soliden Fachleute, und Sie werden es wohl (wie Herr Kowatsch) nie verstehen dass am Boden die reale Sensitivität des CO2 pro Verdoppelung nur 0,6 Grad beträgt aber die Ausgasungssensitivität (z.B. beim Vostok-Eisbohrkern) etwa um den Faktor 30 (!) höher ist, nämlich 6,5 Grad pro 100 ppm. Für einen Anstieg von 280 auf 520 ppm wäre eine Erwärmung von 18,2 Grad nötig.
Die Leute am PIK (Rahmstorf, Schellnhuber) schalten schon um auf eine kommende Eiszeit, so ihre letzten Veröffentlichungen, sog. „Studien“. Allerdings ist bei ihnen die kommende Eiszeit eine Folge der Klimaerwärmung, sie können ja gedanklich nicht einfach ihren Geld bringenden Pfad verlassen. Und die AMOC muss jetzt dafür herhalten, natürlich alles brav im Konjunktiv gefasst.
Ob Schellnhuber seinen übergroßen Globus schon mit einer Eisschicht überzogen hat, über die er dann wie ein kleiner Guru schützend seine Hand hält?
Bei diesem Bild wohl in seiner offenkundigen Lieblingsdarstellung frage ich mich immer, was oder wen will er eigentlich schützen? – Vermutlich einzig die Geldströme auf sein Konto!
Ich bin absolut nicht überrascht von diesen Ergebnissen, denn meine Zustimmung galt bereits Demetris Koutsoyiannis et al. 2023. Der griechische Geo- und Wasserwirtschaftstatistiker hat mich bereits mit seinem „Quiz“ überzeugt.