Hans Jankowiak
Im Teil 1 habe ich dargestellt, dass die benutzten Quellen seit 2016 eine fallende Tendenz der durchschnittlichen globalen Temperaturen aufzeigen (Figur 9 ) obwohl die
CO2 – Messkurve auf dem Mauna Loa anzeigt: CO2–Gehalt steigt weiterhin !! (Figur 10)
Überraschung?
Wohl kaum, denn auch die NASA meldet sich zu Wort:[9]
On June 12, 2019 NASA announced:
Solar Activity Forecast for Next Decade Favorable for Exploration
“The forecast for the next solar cycle says it will be the weakest of the last 200 years. The maximum of this next cycle – measured in terms of sunspot number, a standard measure of solar activity level – could be 30 to 50% lower than the most recent one. The results show that the next cycle will start in 2020 and reach its maximum in 2025.”
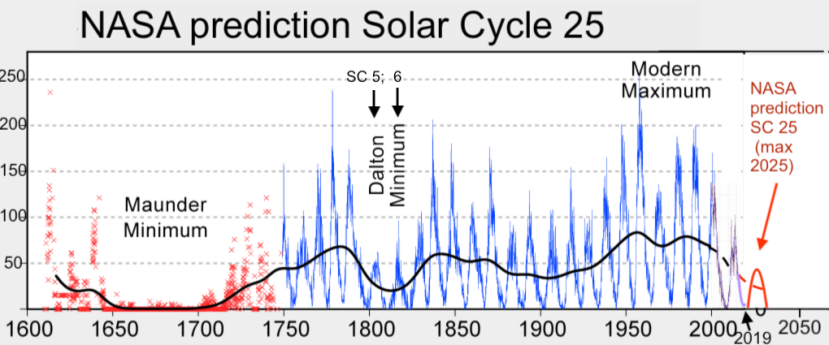
Figur 11 [9]: NASA: Die Sonnenaktivität sinkt
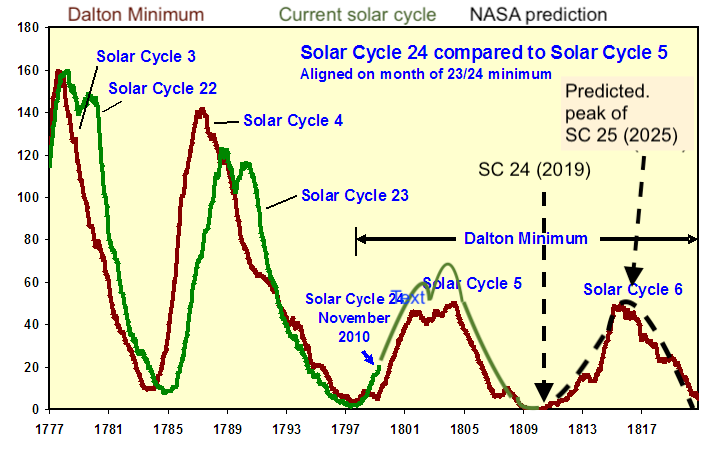
Figur 12 [9]: Kalte Zeiten stehen uns kurz bevor!
1. Prof. Dr. Theodor Landscheidt (1998): (Solar Activity.: A dominant factor in climate dynamics, Absatz 8)
„On this basis, I forecasted, in 1982, that we should expect declining temperatures after 1990 and probably a new Little Ice Age around 2030. In further papers I specified this prediction [58,59,63].I also expected considerably weaker sunspot activity after 1990. The slowly ascending new sunspot cycle, which started in May 1996 *, seems to follow the predicted trend“
*Schwabe-Zyklus 23
Prof. Dr. Theodor Landscheidt (2003): (New Little Ice Age Instead of Global Warming? Absatz 11. Outlook)
„We need not wait until 2030 to see whether the forecast of the next deep Gleissberg minimum is correct. A declining trend in solar activity and global temperature should become manifest long before the deepest point in the development. The current 11-year sunspot cycle 23 with its considerably weaker activity seems to be a first indication of the new ternd, especially as it was predicted on the basis of solar motion cycles two decades ago.“
Und Prof. Dr. Theodor Landscheidt ( † 2004) lag mit seinen auf Berechnungen beruhenden Prognosen mit 95 bis 100% Eintreffen der Ereignisse richtig
- Ende der Dürre in der Sahelzone für 1985
- Überschwemmung in der Po-Ebene in Italien für 2001
- Dürre-Perioden in Western Amerika für 1999
- die letzten El Niño, La Niña
- die Abnahme der Aktivität der Sonnenflecken nach 1990 schon in den
Jahren 1986/87 [10]
2. Dr. Valentina Zharkova (2020): („Modern Grand Solar Minimum will lead to terrestrial cooling“) [11]
Conclusions
(Absatz verkürzt)
During these grand solar minima, there is a significant reduction of solar magnetic field and solar irradiance, which impose the reduction of terrestrial temperatures derived for these periods from the analysis of terrestrial biomass during the past 12,000 or more years. The most recent grand solar minimum occurred during Maunder Minimum (1645–1710), which led to reduction of solar irradiance by 0.22% from the modern one and a decrease of the average terrestrial temperature by 1.0–1.5°C.
This discovery of double dynamo action in the Sun brought us a timely warning about the upcoming grand solar minimum 1, when solar magnetic field and its magnetic activity will be reduced by 70%. This period has started in the Sun in 2020 and will last until 2053. During this modern grand minimum, one would expect to see a reduction of the average terrestrial temperature by up to 1.0°C, especially, during the periods of solar minima between the cycles 25–26 and 26–27, e.g. in the decade 2031–2043.
The reduction of a terrestrial temperature during the next 30 years can have important implications for different parts of the planet on growing vegetation, agriculture, food supplies, and heating needs in both Northern and Southern hemispheres. This global cooling during the upcoming grand solar minimum 1 (2020–2053) can offset for three decades any signs of global warming and would require inter-government efforts to tackle problems with heat and food supplies for the whole population of the Earth.“ (Hervorhebungen durch Verfasser)
Und Frau Dr. Valentina Zharkova hat dieses bereits 2015 voraus gedeutet!
3. Dr. Nils-Axel Mörner (2009): (Solar Minima, Earth`s Rotation and Little Ice Ages in the past and in the future“, Abstract) [12]
„At around 2040-2050 we will be in a new major Solar Minimum. It is to be expected that we will than have a new „Little Ice Age“ over the Arctic and NW Europe.“
Und der Vergleich mit historischen Verläufen des Golfstromes zeigt (siehe Figur 13 unten):
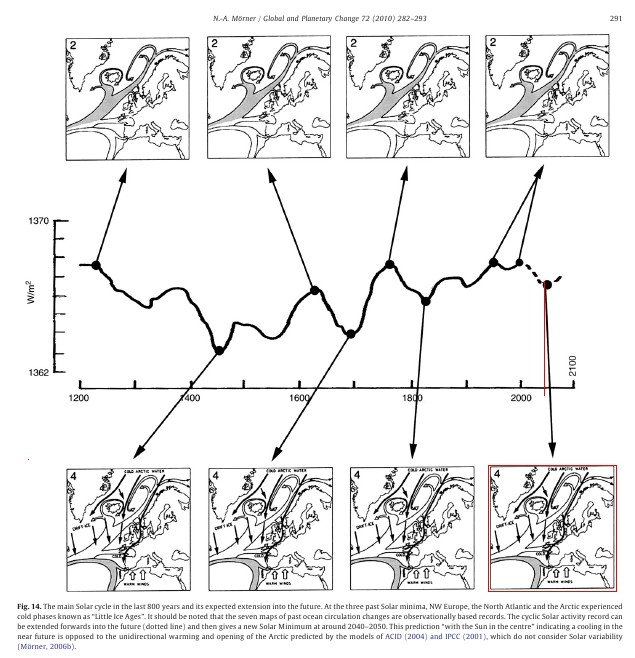
Figur 13 [12]: Der Golfstrom wird seinen nördlichen Einfluss um 2030/2040 herum vermindern.
Das Schwanken („Eiern“) des gesamten Systems um das Barycenter des Sonnen-Planeten-Systems als Ursache für die zyklischen Klimaveränderungen auf der Erde lässt sich innerhalb dieser kurzen Betrachtung nicht oder nur sehr unzureichend darstellen.
Zusammengefasst als „Summery for Policymakers“
Wir schreiben das Jahr 2021, im Januar. Wir haben also beste Bedingungen, den Verlauf des Klimas in den nächsten Jahren mit den Berechnungen der Astro-Physiker und mit den Vorhersagen der IPCC-Klima-Modelle zu vergleichen.
Alles in allem sind sich die Astro-Physiker sehr sicher, dass sie richtig liegen:
Wir gehen in den kommenden etwa 10 Jahren auf ein modernes solares Sonnenflecken-Minimum zu, das um 2030 einen Tiefpunkt erreicht, etwa 20 bis 40 Jahre (bis 2050/2060) andauert und dann erst wieder langsam ansteigt.
Und es wird die nächsten 30 bis 40 Jahre so kalt werden wie um 1670 bzw 1810 !!!!!!
Wir werden es bald sehen, das Jahr 2030 ist nicht mehr allzu weit ferne!
Die Empfehlung kann nur lauten:
- Lasst die Kernkraftwerke am Netz!
- Lasst die Kohlekraftwerke am Netz!
- Baut neue Kernkraftwerke der IV. Generation!
- Bunkert ausreichende Mengen Streusalz!
- Zieht Euch warm an!
Ich sehe uns beim nächsten Alster- Eisvergnügen in Hamburg, so ab 2023 – vielleicht auch schon früher!!
PS
Das folgende Bild lässt uns kalte Zeiten erahnen!
Frau Dr. Valentina Zharkova:[12]

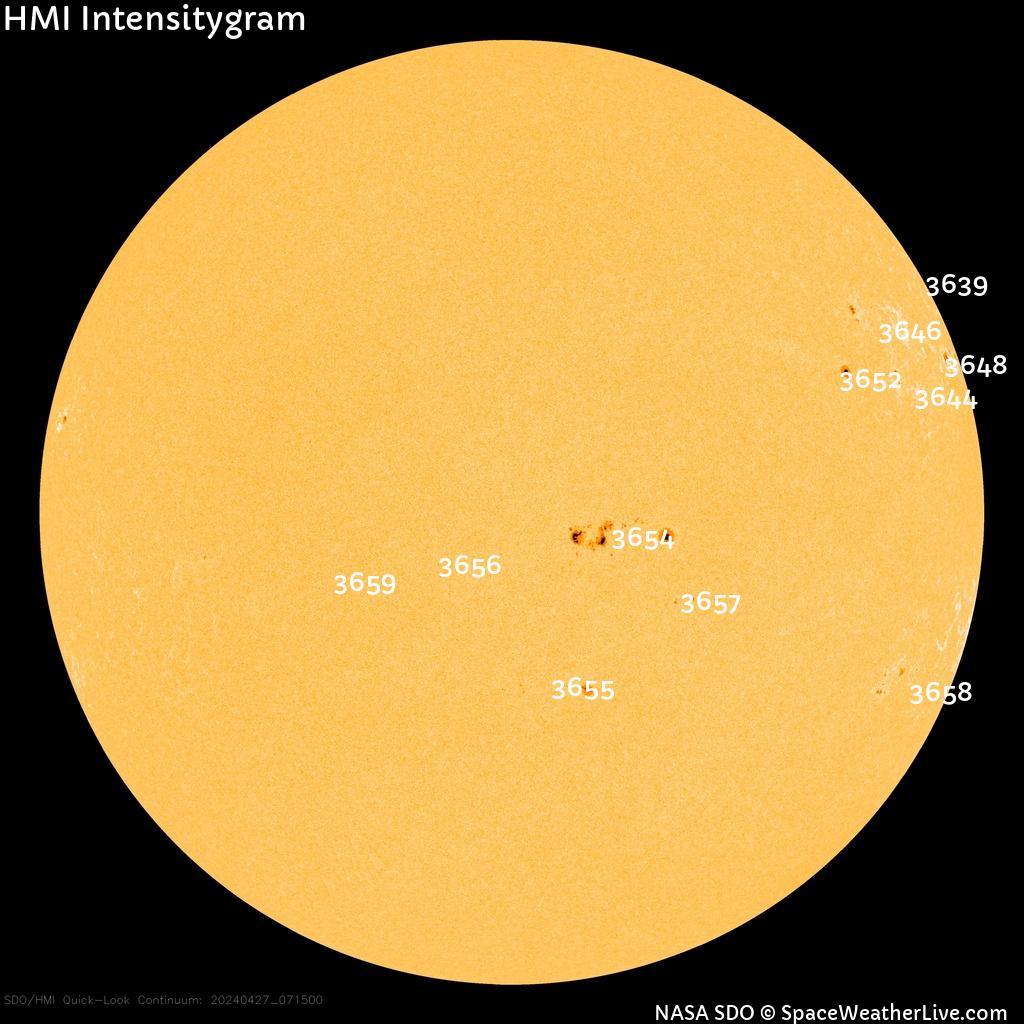
Figur 14 [13]: Kaum Sonnenflecken zu erwarten bis 2040 !!!
[1] https://archive.ipcc.ch/publications_and_data/publications_ipcc_first_assessment_1990_wg1.shtml
[2]
[3]
http://clivebest.com/blog/?p=9252&
[4]
https://www.carbonbrief.org/state-of-the-climate-first-quarter-of-2020-is-second-warmest-on-record
[5]
https://meteo.plus/sonne-1700.php
[6]
https://wiki.bildungsserver.de/klimawandel/index.php/Schwabe-Zyklus
[7]
http://www.centil-europe.ch/Artikeldetail.asp?id=128
[8]
https://www.eike-klima-energie.eu/2020/05/28/klimadebatte-alarmismus-auf-grund-irrefuehrender-daten/
[9]
[10]
„Th. Landscheidt : Long-Range Forecasts of Solar Cycles and Climate Change“
In:Rampino, M.R., Sanders,J.E., Newman,W.S. & Königsson, L.K.
„Climate, History, Periodicity, and Preddictability“ New York, van Nostrand Reinhold, 1987,
Paper 25, S. 421 – 445
[11]
https://www.tandfonline.com/doi/full/10.1080/23328940.2020.1796243
[12]
https://www.sciencedirect.com/science/article/abs/pii/S092181811000010X
[13]


Wir freuen uns über Ihren Kommentar, bitten aber folgende Regeln zu beachten:
- Bitte geben Sie Ihren Namen an (Benutzerprofil) - Kommentare "von anonym" werden gelöscht.
- Vermeiden Sie Allgemeinplätze, Beleidigungen oder Fäkal- Sprache, es sei denn, dass sie in einem notwendigen Zitat enthalten oder für die Anmerkung wichtig sind. Vermeiden Sie Schmähreden, andauernde Wiederholungen und jede Form von Mißachtung von Gegnern. Auch lange Präsentationen von Amateur-Theorien bitten wir zu vermeiden.
- Bleiben Sie beim Thema des zu kommentierenden Beitrags. Gehen Sie in Diskussionen mit Bloggern anderer Meinung auf deren Argumente ein und weichen Sie nicht durch Eröffnen laufend neuer Themen aus. Beschränken Sie sich auf eine zumutbare Anzahl von Kommentaren pro Zeit. Versuchte Majorisierung unseres Kommentarblogs, wie z.B. durch extrem häufiges Posten, permanente Wiederholungen etc. (Forentrolle) wird von uns mit Sperren beantwortet.
- Sie können anderer Meinung sein, aber vermeiden Sie persönliche Angriffe.
- Drohungen werden ernst genommen und ggf. an die Strafverfolgungsbehörden weitergegeben.
- Spam und Werbung sind im Kommentarbereich nicht erlaubt.
Diese Richtlinien sind sehr allgemein und können nicht jede mögliche Situation abdecken. Nehmen Sie deshalb bitte nicht an, dass das EIKE Management mit Ihnen übereinstimmt oder sonst Ihre Anmerkungen gutheißt. Wir behalten uns jederzeit das Recht vor, Anmerkungen zu filtern oder zu löschen oder zu bestreiten und dies ganz allein nach unserem Gutdünken. Wenn Sie finden, dass Ihre Anmerkung unpassend gefiltert wurde, schicken Sie uns bitte eine Mail über "Über Uns->Kontakt"Die globalen Temperaturen sind, wenn man von El Nino-Spitzen absieht, seit etwa 2000 recht konstant. Auf jeden Fall gilt: Die realen Temperaturen geben, ganz im Gegensatz zu den dauerversagenden IPCC-Panikmodellen, wenig Anlass zu Panik. Ob und was das gesättigte anthropogene CO2 zu den globalen Temperaturen tatsächlich beiträgt, dass wird sich vermutlich in den nächsten Jahren noch deutlicher zeigen.
Und dass der IPCC lügt wie gedruckt, das zeigt sich in der schlechten Korrelation von CO2 und Temperaturen – was dem Märchen von der Alleinschuld des anthropogenen CO2 zweifelsfrei widerspricht. Letzteres wieder besonders deutlich seit etwa 2000: Das CO2 steigt derzeit immer noch und zwar mehr mehr denn je – trotz bereits deutlich zugenommener Absorption in Pflanzen und Ozeanen, die noch weiter zunehmen wird. Während sich die globalen Temperaturen wenig änderten.
Man muss sich immer vor Augen halten, die Alarm- und Panikforschung wurde gegründet, um die Menschheit zu alarmieren. Das tut sie unentwegt und mit allen Mitteln. Und FfFs, Medien, Politiker und Verfassungsrichter fallen zuverlässig darauf herein…
Eike möchte mit seinen Artikeln (auch über private Weitergabe) möglichst viele Menschen erreichen. Den vorliegenden Bericht brauche ich in meinem näheren Bekanntenkreis (dörfliches Umfeld, außer mir kein Akademiker) nicht zu zeigen. Sobald meine Freunde (alle zwischen 50 und 60 Jahre alt und somit seit Jahrzehnten nicht mehr im Kontakt mit der englischen Sprache) den englischen Text sehen, wird der Ausdruck weggelegt.
Ich habe leider als freiberuflicher Geologe keine Zeit, mich an das übersetzen von Texten zu machen. Für den Autor sollte es aber, da er durch das Verfassen des Artikels ja bereits im Thema ist und dieses näher kennt, ein leichtes sein, die kurzen Absätze in Deutsch (und wenn es nur in etwa sinngemäß wiedergegeben wird) zu übersetzen.
Andreas Hoemann
Sie sprechen mir aus der Seele. Ich habe es auch überlesen. Ich habe nie Englisch gelernt (DDR) bin über 70 und immer nur die Übersetzungsmatrix einzuschalten, ist mir zu dumm und so gut sind die auch nicht. Ich denke, dass EIKE eigentlich alle informieren will und nicht nur einen elitären Kreis, deshalb sollte Englisches auch übersetzt werden.
Liest der Autor der Artikel hier mit? Oder gehen die Nachfragen zu seinem Artikel quasi in den Papierkorb?
Im Artikel steht:
Der Autor des Artikels hat selbst festgestellt, dass wir seit 1990 einen Anstieg der Temperaturen um 0,6 statt abfallender Temperaturen hatten. Und 2030 a new little ice age, dass sich schon lange vorher bemerkbar machen soll? Das sind nur noch 9 Jahre, also eigentlich schon mitten drin in lange vorher.
Entgeht mir hier irgendwas?
Vielleicht entgehen ihnen einige wichtige Trends:
http://temperature.global/