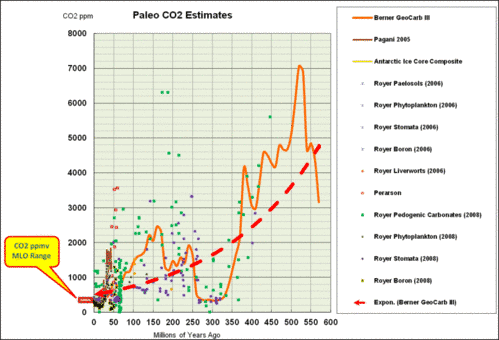
Aus der Abteilung „etwas, das Sie nicht jeden Tag sehen“, stammt die Graphik rechts:
Atmosphärische CO2-Konzentrationen in geologischen Zeiträumen
Quelle: GeoCO2.png Photo by dhm1353 | Photobucket
Mit Dank an Tom Nelson
Auf der folgenden Graphik werden die Quellen gezeigt:

Quelle: http://s90.photobucket.com/user/dhm1353/media/CO2_Decline.png.html
Weitere Datenquellen: (Dank an Bill Illis)
http://www.geocraft.com/WVFossils/Reference_Docs/Geocarb_III-Berner.pdf
ftp://ftp.ncdc.noaa.gov/pub/data/paleo/climate_forcing/trace_gases/phanerozoic_co2.txt
ftp://ftp.ncdc.noaa.gov/pub/data/paleo/climate_forcing/trace_gases/pagani2005co2.xls
ftp://ftp.ncdc.noaa.gov/pub/data/paleo/icecore/antarctica/epica_domec/edc-co2-2008.xls
ftp://ftp.ncdc.noaa.gov/pub/data/paleo/climate_forcing/trace_gases/royer2006co2.xls
(Verwenden Sie nicht die Boron- oder Paleosol-Methode! Sie sind unzuverlässig!) ftp://ftp.ncdc.noaa.gov/pub/data/paleo/paleocean/by_contributor/pearson2000
ftp://ftp.ncdc.noaa.gov/pub/data/paleo/ipcc2007/ipcc2007fig61top.xls
ftp://ftp.ncdc.noaa.gov/pub/data/paleo/contributions_by_author/pearson2009/pearson2009.xls
ftp://ftp.ncdc.noaa.gov/pub/data/paleo/contributions_by_author/tripati2009/tripati2009.xls
http://www.snowballearth.org/Bao08.pdf
ftp://ftp.ncdc.noaa.gov/pub/data/paleo/contributions_by_author/hoenisch2009/hoenisch2009.xls
http://www.nature.com/ngeo/journal/v4/n7/extref/ngeo1186-s1.xls
http://www.nature.com/nature/journal/v486/n7401/extref/nature11200-s2.xls
http://www.nature.com/nature/journal/v486/n7401/extref/nature11200-s2.xls
Link: http://wattsupwiththat.com/2013/08/08/an-illustration-that-co2-wont-roast-the-earth-in-a-runaway-tipping-point/
Übersetzt von Chris Frey EIKE
Eine Illustration, dass das CO2 die Erde nicht in einem Runaway-Tipping-Point rösten wird…












Wir freuen uns über Ihren Kommentar, bitten aber folgende Regeln zu beachten:
- Bitte geben Sie Ihren Namen an (Benutzerprofil) - Kommentare "von anonym" werden gelöscht.
- Vermeiden Sie Allgemeinplätze, Beleidigungen oder Fäkal- Sprache, es sei denn, dass sie in einem notwendigen Zitat enthalten oder für die Anmerkung wichtig sind. Vermeiden Sie Schmähreden, andauernde Wiederholungen und jede Form von Mißachtung von Gegnern. Auch lange Präsentationen von Amateur-Theorien bitten wir zu vermeiden.
- Bleiben Sie beim Thema des zu kommentierenden Beitrags. Gehen Sie in Diskussionen mit Bloggern anderer Meinung auf deren Argumente ein und weichen Sie nicht durch Eröffnen laufend neuer Themen aus. Beschränken Sie sich auf eine zumutbare Anzahl von Kommentaren pro Zeit. Versuchte Majorisierung unseres Kommentarblogs, wie z.B. durch extrem häufiges Posten, permanente Wiederholungen etc. (Forentrolle) wird von uns mit Sperren beantwortet.
- Sie können anderer Meinung sein, aber vermeiden Sie persönliche Angriffe.
- Drohungen werden ernst genommen und ggf. an die Strafverfolgungsbehörden weitergegeben.
- Spam und Werbung sind im Kommentarbereich nicht erlaubt.
Diese Richtlinien sind sehr allgemein und können nicht jede mögliche Situation abdecken. Nehmen Sie deshalb bitte nicht an, dass das EIKE Management mit Ihnen übereinstimmt oder sonst Ihre Anmerkungen gutheißt. Wir behalten uns jederzeit das Recht vor, Anmerkungen zu filtern oder zu löschen oder zu bestreiten und dies ganz allein nach unserem Gutdünken. Wenn Sie finden, dass Ihre Anmerkung unpassend gefiltert wurde, schicken Sie uns bitte eine Mail über "Über Uns->Kontakt"Hallo Werter Herr Dr.Paul
Sorry – Da habe ich ein Umrechnungs-Fehler gemacht.
Der Druck in Tropopause-Höhe auf der Venus ist nicht 100 kPa, sondern 10 kPa.
Mfg
W. Kinder
Hallo Werter Herr Dr.Paul
Man kann eine p-T Berechnung ja auch mal aus Sicht der Tropopause ohne Wärmeaustausch mit der Umgebung (adiabatisch) durchführen.
+ Erde: Tropopause beginnt bei einer Temperatur ca. 220 K mit einem Druck von 22 kPa in der Höhe von 12 km
Unter adiabatischer Prozessführung (adiabatische Kompression mit dT/dz = 9,8 K/km) würde man eine Temperatur von 220K + 12km*9,8K/km = 340K auf der Oberfläche erhalten.
+ Venus: Tropopause beginnt bei einer Temperatur ca. 240 K mit einem Druck von 100 kPa in der Höhe von 60 km
Unter adiabatischer Prozessführung (adiabatische Kompression mit dT/dz = 11,7 K/km) würde man eine Temperatur von 240K + 60km*11,7K/km = 942K auf der Oberfläche erhalten.
Mfg
W. Kinder
@ #66: Dr.Paul sagt am Mittwoch, 28.08.2013, 21:33
„Dazu reichen die Gasgesetze:“
@ #60: Gerald Pesch sagt am Dienstag, 27.08.2013, 12:39
„Was man da sieht, ist der Temperaturverlauf in Folge des Druckgradienten; genau so wie hier beschrieben“
Das trifft nur für die Troposphäre zu und ist Folge der Konvektion. Die Konvektion reicht im Wesentlichen nur bis zur Tropopause.
Das überhaupt Konvektion ist, folgt daraus, daß ohne Konvektion der Temperaturgradient viel größer wäre, d.h. ohne Konvektion wäre auch die Temperatur der Venusoberfläche viel höher.
Für Begriffsstutzige noch eine zusätzliche Erklärung. Die Behinderung der Strahlungsausbreitung hängt mit der Menge der Treibhausmoleküle zusammen. Oder anders – ohne Konvektion haben Höhenabschnitte mit gleichen Treibhausgas-Molekülmengen gleiche Temperaturdifferenzen. Da nach unten wegen des zunehmenden Druckes die Höhe dieser Höhenabschnitte immer kleiner werden, steigt nach unten der Temperaturgradient. Das hat keine irgend geartete Grenze. Aber die von Pesch und Paul genannten Gasgesetze erzwingen ein Einsetzen der Konvektion, wenn der strahlende Temperaturgradient den konvektiven Temperaturgradienten erreicht [Schwarzschild-Kriterium – http://tinyurl.com/schwark S. 88(20) Gl. (6.127)]
Wegen der Druckabhängigkeit der Höhenabschnitte sind bei geringen Druck die Höhenabschnitte groß und damit der Temperaturgradient klein. Deswegen beginnt jede Atmosphäre mit einem konvektionsarmen Höhenbereich (Stratosphäre) und geht dann in einen konvektionsreichen Bereich (Troposphäre) über.
Da bei den durch Konvektion vorgebenen Temperaturgradienten für eine bestimmte Höhendifferenz die Menge der Treibhausgasmoleküle nach unten immer mehr zunimmt, folgt im Umkehrschluß, daß die durch Strahlung transportierte Wärme nach unten immer geringer wird. Für die Erde gilt im Durchschnitt, daß die unten transportierte Wärmemenge ca. 60 W/m² ist und die unten konvektiv transportierte Wärmemenge ca. 90 W/m². Bis zur Tropopause ist dann der Strahlungstransportwiderstand so stark gesunken, daß die Gesamtleistung von ca. 150 W/m² allein durch Strahlung transportiert wird – die Stratosphäre beginnt.
Und Leute, die den Treibhauseffekt bestreiten wollen, ignorieren immer die Existenz der Stratosphäre.
MfG
Hallo Werter Herr Dr.Paul
falls es Sie interessiert, eine Pressemeldung.
„Venus Express“ fand heraus (nach der Methode des Aerobraking), dass die Atmosphäre nicht homogen, sondern an den Polen um 60% dünner ist als erwartet. Außerdem scheint es zwischen Tag- und Nachtseite einen signifikanten Dichteunterschied zu geben. Da werden die Daten des Pioneer Venus Orbiter und der Magellan-Mission aus den achtziger und neunziger Jahren wohl noch ziemlich korrigiert werden – die flogen über die Äquatorregion, und die eifrigen Wissenschaftler berechneten damals aus deren Messungen einfach die Werte für den ganzen Planeten.
Mfg.
W. Kinder
Hallo Werter Herr Dr.Paul (#66)
Hier die Umformung: p * V = (m/M) * R * T -> p = m/V * R/M * T -> p = rho * Rs * T mit Rs = R/M die spezifische Gaskonstante.
Es ist auch ein Fehler in der Berechnung, man muss auch die verschiedenen spez. Gaskonstanten mit einbeziehen.
Dieser Fehler wirkt sich aber nicht sehr stark auf das Endergebnis aus, weil es logarithmisch ist (Index e = erde; Index v = venus).
rho_v/rho_e = R_e/R_v*T_e/T_v*p_v/p_e = 287/192*288/740*92/1 = 53
GHG-Verhältnis Venus/Erde: rho_vghg/rho_eghg = 53*(1/0,03038) = 1744
Damit erhält man: e = log(2,57)/log(1744) = 0,126 (statt 0,13)
Sie können die gleiche Rechnung mal für den Planeten Mars durchführen. Hier ein paar Daten für den Mars:
Bestandteile der Mars-Atmosphäre: 95,3% CO2, 2,7% N2 und 1,6% Argon (andere Bestandteile 0,3%)
Radius des Planeten: r = 3386200 m
Molare Masse der Mars-Atmosphäre: M = 0,953*44,01 g/mol + 0,027*28,02 g/mol + 0,016*39,95 g/mol = 43,34 g/mol = 0,04334 kg/mol
Masse der Mars-Atmosphäre: mAt = 2,46*10^16 kg
Größe der Mars-Oberfläche: Ao = 4*pi*r^2 = 1,44*10^14 m^2
Stärke des Gravitationsfeldes vom Mars an der Oberfläche: g(0) = 3,71 m/s^2
Abnahme der Stärke des Gravitationsfeldes mit der Höhe h: g = g(0) * r^2/(r+h)^2
Universelle Gaskonstante: R = 8,314472 J/(mol*K)
Mittlere Dichte Mars-Atmosphäre: 0,0148 kg/m^3
Atmosphärendruck auf Marshöhe Null: 636 Pa (6,36 mbar)
Mittlere oberflächennahe Temperatur: 223 K
Spezifische Gaskonstante Rs = R/M: 191,8 J/(kg*K)
Mfg
W. Kinder
Wieder mal Märchenstunde bei Dr. Paul (#66)
Herr Paul, es ist ja recht amüsant Ihren selbst ausgedachten Theorien „zuzusehen“. Aber wann kommen Sie endlich zu dem Schluss, dass der Treibhauseffekt die Temperatur steigen lässt, und deswegen der Druck steigt (wie schon bei der Dampfmaschine) und nicht umgekehrt.
#43: Sehr geehrter Herr Kinder, den link
hab ich nicht ganz verstanden,
was meinte er mit dem „CO2-Treibhauseffekt“ ?
Bei einem Druck von ca. 92 atm auf der Venus ist der doch nun endgültig widerlegt.
Dazu reichen die Gasgesetze:
p * V = n * R * T
Daraus folgt
p * V = (m/M) * R * T
und aufgelöst nach der Dichte
rho = (p * M) / (R * T)
T*rho= (p * M) / R
T= (p * M) / R *rho
Gruß
#58: NicoBaecker, die Schwerkraftwirkung erleichtert die Konvektion (Auftrieb durch Gewichtsverminderung), aber nicht umgekehrt.
Der adiabatische Dichte-Druck-und Temperaturgradient
hat nichts mit Konvektion zu tun.
Aber das ist zu schwierig für die Treibhaustraumwelt.
gruß
Lieber Herr ochs,
ich liebe Faust. Aber ich muss leider bestehen, nur den 1. Teil geelsen zu haben. Der 2. schlummert seit Jahren im Regal.
Ichnkann Ihnen jedoch versichern, dass der 1. Teil garantiert nichts zur Physik des Treibhauseffekts auf der Venus enthaelt. Von da her werden Sie mit Goethes Vorstellungen hier Schiffbruch erleiden. Ich glaube auch nicht, dass man faustische Anmassungen entwickeln muss, um sagen zu koennen, ein physikalisches Problem sei geloest.
#61
Herr Baecker,
lese ich da eine gewisse Wut heraus? zitat,“..des ewig Dummbleibens..“
😉
Als Akademiker haben sie möglicherweise mal etwas mit „Faust“ zu tun gehabt?
evtl. in der Schule?
Sofern sie denn Zeit dafür erübrigen können, sollten sie sich mal mit „Johann Georg Faust“ beschäftigen, welcher wohl in gewisser Weise für Goethes Faust als Vorbild diente.
MfG
Lieber Herr ochs, #61
„das ist doch schon für sie, wenn sie auf dieses Weise ihre eigenen Zweifel beseitigt haben.“
Ohne Zweifel wäre die Wissenschaft langweilig. Ich nutze ihn im Gegensatz zu Ihnen nicht zur Rechtfertigung des ewig Dummbleibens, sondern zum Erkenntnisgewinn.
„Ich halte das eindimensionale numerische Modell in der Dissertation für Zeitverschwendung.“
Wieso? Es ergänzt doch das, was die Wissenschaft bislang über die Venusatmosphäre rausgefunden hat. PS: es gibt sicherlich auch 3D Modelle.
Herr Baecker,
das ist doch schon für sie, wenn sie auf dieses Weise ihre eigenen Zweifel beseitigt haben.
Ich halte das eindimensionale numerische Modell in der Dissertation für Zeitverschwendung.
MfG
#53: Ebel sagt:
am Freitag, 23.08.2013, 10:25
@ #50: Gerald Pesch sagt am Donnerstag, 22.08.2013, 18:20
„Was lesen wir in Ihrem Link:“
Ja – auch das steht darin. Aber es gehtum den Temperaturverlauf infolge des Treibhauseffektes. Und den finden Sie in dem Paper ausführlich.
Antwort:
Was man da sieht, ist der Temperaturverlauf in Folge des Druckgradienten; genau so wie hier beschrieben:
http://goo.gl/EtsHLN
Die Hypothese der Temperaturwirksamkeit insbesondere von CO2-Anteilen in der Luft wird vielfach (so auch in [7]) von den Verhältnissen auf dem Planeten Venus mit der dortigen CO2-Atmosphäre abgeleitet. Unterstellte man in dem oben unter 4. vorgestellten Modell an Stelle der Luft eine Gasschicht aus CO2 und einen Druck am Boden dieser Gasschicht von 90 bar (egal, ob durch Dicke der Gasschicht oder Gravitation des festen Kerns hervorgerufen), dann würde dort in Bodennähe eine Temperatur von ca. 460oC herrschen; dies ist das Beispiel der Venus-Atmosphäre, auch hier gibt es praktisch keine Einflüsse durch Strahlungsabsorption. Bemerkenswert an dem Beispiel der Venus-Atmosphäre ist noch ein Punkt: Bestünde die Atmosphäre der Venus nicht vorwiegend aus CO2, sondern aus Luft, dann wäre es dort – bei unterstellten unveränderten Druckverhältnissen – noch um rd. 200 K wärmer. Die Ursachen hierfür liegen in dem für 3-atomige Gase etwas geringeren Wert k (Verhältnis der spezifischen Wärmewerte cp zu cv: Luft: 1,4; CO2: 1,3).
#47: „Strahlungsgleichgewichtstemperatur Erde : 255 K
Mars : 226 K
Mittlere Temperatur in Bodennähe : Erde : 290 K
Mars : 210 K“
Sehr geehrter Herr Pesch, Sie hatten schon vor ca. einem Jahr diese Zahlen genannt:
http://tinyurl.com/m2h6h35
Daraufhin hatte ich auf die Zahlen verwiesen, die ich gefunden hatte, 217 K und 225 K:
http://tinyurl.com/mxryn7o
Spätestens da könnten Sie Ihre Zahlen auf den genaueren Stand bringen, oder was denken Sie? Das Internet vergisst nix. 🙂
Lieber Herr Paul, #57
„wie die Schwerkraftwirkung auf ein komprimierbares Gas“
… ist selbstverständlich bei den hier verwendeten radiativ-konvektiven Modellen berücksichtigt, weswegen heißt es ja auch „konvektiv-..“, eigentlich ganz einfach.
#56: NicoBaecker das leugnen einfacher physikalischer Zusammenhänge,
wie die Schwerkraftwirkung auf ein komprimierbares Gas
ist unter Treibhauskünstlern in der Tat weit verbreitet.
Das geht ja bis Spencer,
der den adiabatischen Gradient gar nicht verstanden hat. Für Sie ist er wohl auch ein unüberwindliches Hindernis.
mfG
Lieber Herr ochs,
wieso sollte ich die Venusatmosphaere modellieren? Mir reicht, was andere darueber rausgefunden haben und zur Beantwortung der hier aufgeworfenen Zweifel reicht das ja allemal. In der Diss und bei Pollack finden Sie, dass das CO2 auf der Venus fuer ueber 400 Grad bodennahe Temperaturerhoehung, die Wolken fuer unter 200 Grad etc. gegenueber dem wolkenfreien Zustand verantwortlich sind. Damit ist die Frage, wieviel Treibhauseffekt das CO2 auf der Venus macht fuerdie hier aufgeworfene Fragen wissenschaftlich eindeutig und mehr als ausreichend beantwortet.
@ #32
„Man sollte zumindest wissen, dass Wolken aus WASSER (und od. Eis) bestehen und NICHT aus Wasserdampf!“
Auch nur die halbe Wahrheit. Hab mir vor zwei Stunden ein paar solcher Dinger mal aus nächster Nähe angeschaut. :-))
#52
Herr Baecker,
es liegt mehr fern ihnen Alternativen aufzuzeigen. Es steht Ihnen doch frei, die Atmossphäre der Venus zu modellieren und dazu Rechner zu verwenden.
Aber es bleibt eben ein Modell und im Falle der von ihnen verlinkten Dissertation, eben ein eindimensionales.
MfG
@ #50: Gerald Pesch sagt am Donnerstag, 22.08.2013, 18:20
„Was lesen wir in Ihrem Link:“
Ja – auch das steht darin. Aber es gehtum den Temperaturverlauf infolge des Treibhauseffektes. Und den finden Sie in dem Paper ausführlich.
Aber offensichtlich beweist das Paper auch für Sie den Treibhauseffekt so eindeutig, daß Sie nur eine kurze Bemerkung am Rande hochstilisieren. Schämen Sie sich.
Deswegen trifft Ihre Bemerkung für Sie als Strohmann zu, auch wenn Sie versuchen abzulenken:
@ #50: Gerald Pesch sagt am Donnerstag, 22.08.2013, 18:20
„aber Ihnen geht es ja eh nur darum, einen Strohmann zu plazieren…“
MfG
Lieber Herr k.ochs, #51
„diese Dissertation befasst sich mit einem numerischen Model.“
…welches den Sinn hat – wie immer in der Physik – die Beobachtungen auf Basis der physikalischen Gesetze zu erklären. Was ist virtuell daran, quantitative Zusammenhänge der Physik durch einen Computer lösen zu lassen?
Was haben Sie denn für eine Alternative?
Ich sehe keine adäquate, denn wenn ich die physikalischen Gesetze niederschreibe, die in der Venusatmosphäre wirken, komme ich schnell zum Punkt, wo man mit Papier und Bleistift nicht mehr weiterkommt, verstehen Sie? Oder haben Sie eine quantitative Lösung parat, wie die Lichtstreuung in diffusen Schwefelwolken und andere Effekte mit dem Wärmetransport etc. in der Atmosphäre quantitativ zusammenhängt?
#49
Herr Baecker,
diese Dissertation befasst sich mit einem numerischen Model.
Ich erkläre ihnen gerne den Unterschied zwischen virtuell und real.
Weiterhin habe keine Zeit mich mich virtuellen Welten zu beschäftigen. Verstehen sie das?
MfG
#49: Ebel sagt:
am Donnerstag, 22.08.2013, 15:46
Was lesen wir in Ihrem Link:
The following graphs are provided as a first step in checking up on whether or not a suitable temperature, pressure, and chemically friendly environment for the production or replication of viruses exists in the Venusian atmosphere.
Hat zwar nichts mit dem „Treibhauseffekt“ durch CO2 zu tun, aber Ihnen geht es ja eh nur darum, einen Strohmann zu plazieren…
@ #47: Gerald Pesch sagt am Donnerstag, 22.08.2013, 12:29
„Nach der Treibhaushypothese müssten bereits dort …“
Aber nur nach Ihrer falschen Vorstellung, mit den wirklichen Treibhauszusammenhängen hat das nichts zu tun.
Besser ist das schon zu sehen bei http://tinyurl.com/Fritzius
Wenn Sie die richtigen Zusammenhänge wissen wollen, dann sollten Sie lesen:
#14: Ebel sagt am Montag, 19.08.2013, 12:33
MfG
@ #45: Alfred Schlohr sagt am Donnerstag, 22.08.2013, 09:42
„Ich kenne die Arbeiten von Gerlich. Er hat keinen Unsinn zurück genommen, sondern eine unsaubere Formulierung in der ersten Version korrigiert – not more and not less.“
Die Arbeit von Gerlich besteht tatsächlich nur aus unsauberen Formulierungen, die Laien falsch interpretieren. Dazu kommt das Unwesentliches ganz breit ausgewalzt wird und Wesentliches fehlt – z.B. der turbulente Wärmeleitwert.
Typisches Beispiel ist auch von Gerlich und Tscheuschner in http://tinyurl.com/FehUns p. 65 Equ. (89) geschrieben. Teff rad sind die -18°C. Tmean ist die Durchschnittstemperatur. Nach Eq. (89) ist die Durchschnittstemperatur immer kleiner als die -18°C. Siehe Tabelle 12 auf Seite 64 und deswegen wird jemand, der keinen Unsinn schreiben will, schreiben das „Tmean ist kleiner als Teff rad“. Was aber schreibt G&T? „Teff rad ist größer als Tmean“.
Wenn Sie in der Widerlegung des Unsinns von G&T ( http://tinyurl.com/TGerlTs ) Fehler finden, lassen Sie es uns hier wissen.
Anmerkung: Viele glauben, daß G&T die Gegenstrahlung bestritten hätten. Mit der Korrektur der von Ihnen genannten „Korrektur“ ist aber die Gegenstrahlung zweifelsfrei bestätigt – aber auch diese Korrektur nutzten G&T zur Vernebelung.
MfG
Was die anderen Planeten angeht, sieht es dort schlecht aus für die CO2 Klimaerwärmung:
CO2 Partialdruck Erde: 36 Pa
Mars: 608 Pa
Effektive Einstrahlung: Erde: 239 W/m²
Mars: 125 W/m²
Strahlungsgleichgewichtstemperatur Erde : 255 K
Mars : 226 K
Mittlere Temperatur in Bodennähe : Erde : 290 K
Mars : 210 K
Ups, wo ist er denn der CO2 Treibhauseffekt auf dem Mars ???
Trotz einer 17 x höheren CO2 Konzentration ?? Andere Planeten, andere Physik…..
http://goo.gl/y0jj8L
Nach der Treibhaushypothese müssten bereits
dort durch Wärmestau unerträglich hohe Temperaturen herrschen, was aber nicht
der Fall ist. Wie Abb. 2 des o.g. Nature Reports deutlich zeigt, verhält sich
das Temperaturprofil bis in etwa 60 km über Grund nahezu identisch zu dem der
Erdatmosphäre. Und schon kurz darüber wird die Venus-Atmosphäre sogar rapide
kälter als die Erdatmosphäre bei gleicher Druckhöhe. In etwa 80 km Höhe ist die
Venus-Atmosphäre mit ca. 120 ° C etwa so kalt wie die Erdatmosphäre in ihrem
kältesten Bereich in der Mesosphäre, und das trotz der etwa doppelt so starken
Sonneneinstrahlung durch die größere Nähe der Venus zur Sonne.Fazit: Nicht der hohe CO2-Gehalt, sondern der hohe Gasdruck
am Venus-Boden ist die Ursache für die hohe Bodentemperatur auf der Venus.
Lieber Herr k.ochs, #41
„Dort werden die Ergebnisse eines numerischen Modells mit völlig unbekannten und somit willkürlich gewählten Anfangsbedingungen geschildert.“
Die Anfangsbedingungen sind wenigstes dem Autoren bekannt. Ob sie -wie Sie behaupten- willkürlich sind, kann sich bestenfalls erst zeigen, wenn sie bekannt sind. Klären Sie das bitte statt zu spekulieren.
Lieber Herr Klasen, #44
„Herr Baecker (?) schon verwunderlich, wie sie einen Bericht aus dem Jahr 2003 als „aktuell“ interprtieren …“
Was soll das nun? Wie Sie oben sehen, habe ich überhaupt nichts von „aktuell“ geschrieben.
#42: Ich kenne die Arbeiten von Gerlich. Er hat keinen Unsinn zurück genommen, sondern eine unsaubere Formulierung in der ersten Version korrigiert – not more and not less.
#38: NicoBaecker sagt:am Mittwoch, 21.08.2013, 16:59
Lieber Herr Klasen,
interessanter link in der Tat, z.B. http://tinyurl.com/lb9cuot
——
Herr Baecker (?) schon verwunderlich, wie sie einen Bericht aus dem Jahr 2003 als „aktuell“ interprtieren …
Hallo,
hier ein Link zu einer Vergleichsrechnung Erde/Venus:
http://tinyurl.com/nyagkr7
Mfg.
W. Kinder
@ #40: Alfred Schlohr sagt am Mittwoch, 21.08.2013, 20:45
„Widerlegen Sie Gerlich,“
G&T haben sowohl Unsinn als auch Richtiges geschrieben. Die Widerlegung des Unsinnsanteil finden Sie in http://tinyurl.com/TGerlTs
Übrigens: Einen Teil ihres Unsinns haben G&T selbst zurückgenommen:
„Reply …“ http://tinyurl.com/gerliic S. 1339 (7): „Wir haben nie behauptet – … – dass ein kälteren Körper [hier der wirksame Atmosphärenanteil] keine Strahlen [Gegenstrahlung] an einen wärmeren sendet. … der kältere Körper strahlt weniger intensiv [hier beispielsweise 35,6 W/m²] als der wärmere Körper [hier beispielsweise 36,6 W/m²]. (We never claimed – … – that a colder body does not send radiation to a warmer one. … the colder body that radiates less intensively than the warmer body warms up the warmer one.)“.
MfG
#36
Herr Schlohr,
ich denke das Studium dieser Dissertation, können Sie sich in der Tat sparen.
Dort werden die Ergebnisse eines numerischen Modells mit völlig unbekannten und somit willkürlich gewählten Anfangsbedingungen geschildert.
Das erinnert stark an die „Modellbauer“ vom PIK o.ä. . Könnte…wahrscheinlich…möglicherweise…ist nicht auszuschliessen…
MfG
Ach, Herr Baecker, mal wieder ein typisch dummer Einwand von Ihnen, mehr scheinen Sie nicht zu bieten zu haben. Da wird mir doch gerade wieder schlecht ! Widerlegen Sie Gerlich und halten Sie bis dahin doch einfach mal die Klappe bzw. ihre Finger ruhig mit dem Unsinn, den Sie hier tagtäglich von sich geben. Ihre Taktik, alles zu zerreden und abzulenken, ist doch für jeden halbwegs intelligenten Menschen klar ersichtlich. Ich könnte Stunden und Tage damit verbringen, Ihren Unsinn zu widerlegen – auf diese Taktik der AGW-Jünger, die es schaffen, die Leute zu verdummen, falle ich aber nicht rein. Sie lenken ab, zitieren irgendeine Doktorarbeit, unterstellen Leuten, keine Ahnung zu haben, usw.. Widerlegen Sie Gerlich, der die AGW-Jünger als das bezeichnet hat, was sie sind: SCHARLATANE. Ihre Penetranz ist (im negativen Sinne) beeindruckend, und als Erklärung habe ich nur, dass Sie dafür bezahlt werden, hier den Foren-Troll zu spielen. Warum die EIKE-Redaktion Ihnen hier Schreib- bzw. Rederecht einräumt, weiß ich nicht. Zumindest müssen Sie dem PIK sehr sehr nahe stehen. Solche Menschen gibt es, und die wird es auch immer wieder geben.
Ich mache Ihnen einen Vorschlag, ich habe, wie gesagt, noch ein paar andere Dinge zu tun und werde nicht dafür bezahlt, hier auf die Foren-Trolle zu reagieren. Fassen Sie mal kurz die Dissertation mit Ihren eigenen Worten zusammen. Danach ueberlege ich mir, ob es wert ist, mich darauf einzulassen. Ausserdem haben Sie meine Fragen nicht beantwortet, wohl, weil Sie es nicht können.
Lieber Herr Schlohr,
Sie werden nicht nur die Diss studieren muessen, sondern auch noch die aeltere Fachliteratur, um Ihr duerftiges Wissen ueber die Venus aufzumoebeln und hier mitreden zu koennen.
Lieber Herr Klasen,
interessanter link in der Tat, z.B. http://tinyurl.com/lb9cuot
hi,
und warum ist die Venus dann kälter als sie eigentlich sein sollte?
mfg
Ähm, Herr Baecker: Jetzt werden Sie aber sehr unwissenschaftlich. Über die VENUS ist so gut wie nichts bekannt, lediglich kennt man rudimentär ihre Atmosphärenzusammensetzung, den Druck und die Oberflächentemperatur aus den wenigen Missionen. Ohne die Dissertation gelesen zu haben (habe noch ein paar andere Dinge zu tun), behaupte ich, dass in dieser sehr viel spekuliert wird. Welche Temperatur hätte die Erde, wenn sie an der Oberfläche einen Druck von 100 Atmosphären hätte, bei einem CO2-Gehalt, der auf das Volumen bezogen 0,04 % wäre ? Was ist Ihre Einschätzung ? Oder meinen Sie, die Erde hätte auch dann die gemütlichen + 15 Grad, weil sie ohne „Treibhausgase“ ja angeblich -18 Grad kalt wäre ?
Haben Sie eigentlich nichts Besseres zu tun, als sich hier mit den AGW-Thesen einzubringen ? Ihr Zeitaufwand ist beachtlich (Ihre Zeit dafür habe ich nicht, da ich noch anderes zu tun habe), und das kann doch eigentlich nur bedeuten, dass Sie abgestellt wurden, um bei EIKE jeden Beitrag in die AGW-Richtung zu kommentieren. Zugegeben, manche Ihrer Beiträge sind gar nicht übel, manchmal aber auch einfach nur ideologisch motiviert. Haben Sie eigentlich Gerhard Gerlich schon widerlegt ? Darauf warte ich noch, das paper könnte heissen: „Nico Bäcker – falsification of the falsification of the atmospheric greenhouse effect by Gerhard Gerlich and Ralf Tscheuchner“. Na, schreiben Sie doch mal …..
Liebe Venus-Interessierte,
studieren Sie mal diese Dr.-Arbeit. Da finden Sie auch weitere Literatur und die Frage nach der Sensitivität der Oberflächentemperaturen der Venus auf CO2 beantwortet (u.a. Gase + Wolken)
http://tinyurl.com/PhDThesisBullockVenus
Lieber Herr Sander, #31
Ihre Punkte 1. … sind bekannt, nur Ihre Schlußfolgerung ist Bauchgefühl. Die wissenschaftlichen Schlußfolgerungen daraus und unter Berücksichtigung sonstiger Erkenntnisse für die gegenwärtige und historische Venusatmosphäre finden Sie in der Fachliteratur. Nur darauf basiert meine Aussage in #1:
a) Die Erde wird nicht geröstet, die Erde wird nicht mal ihre belebte Welt durch anthropogene CO2-Emissionen grundsätzlich verlieren, wohl aber kann sich letztere je nach Ausmaß mehr oder weniger aufgrund der Klimaänderung ändern.
b) Die Venus hat ihr Wasser durch einen runaway-Treibhauseffekt verloren.
Vielleicht ist den Diskussionsteilnehmern die ESA-HP mit den aktuellsten Forschungsergebnissen hilfreich!
http://tinyurl.com/lx82ej8
@ Sander #31
„“Die Wolken (aus Wasserdampf) reduzieren aber die Abstrahlung in den Weltraum““
Man sollte zumindest wissen, dass Wolken aus WASSER (und od. Eis) bestehen und NICHT aus Wasserdampf!
zu #29: NicoBaecker sagt:
Ja, folgt man der Fachliteratur sehen Sie das falsch. Kann man auch erfahren, wie Sie durch welche Berücksichtigung zu dieser Schlußfolgerung kommen? Oder war Ihr Bauchgefühl schon alles an Argumentation?“
Es ist nicht nur mein Bauchgefühl, was mir das sagt. Ich war auch noch nicht auf der Venus. Astronomen und die NASA haben aber ermittelt:
1. Es gibt regelmäßig Vulkanausbrüche (mit Schwefel)
2. Oberhalb und unterhalb der Wolkendecke (die aus Wasserdampf und Schwefelsäuretropfen besteht) gibt es jeweils eine Dunstschicht.
3. Die Wolkendecke und die Dunstschichten sind dauernd geschlossen.
4. Wasserdampf hat ein breites Absorptionsspektrum im IR-Bereich.
5. Die Wolken absorbieren nur 2/3 der nicht reflektierten Sonnenstrahlung. Sie haben eine Oberfläche ohne Struktur und refektieren 75% der Sonnenstrahlung zurück in den Weltraum.
5.Nur 2% des Sonnenlichts kommt wegen der Wolkenschicht und Dunstschichten bis zum Boden.
Die Astronomen sind noch immer der Meinung, dass sie die Ursachen für die Temperatur nur zu einem geringen Teil kennen.
Und nun noch mein Bauchgefühl in Kurzfassung:
Wir nehmen einen Winter in Deutschland. Ist der Himmel voller Wolken ist es noch ausreichend warm. Verschwinden die Wolken jedoch, sinkt innerhalb kürzester Zeit die Temperatur. Diese Temperaturabsenkung passiert auch, wenn am Tag Tag Wolken da waren und die Atmosphäre noch etwas wärmer war. Da wird nicht viel Energie in der Atmosphäre gespeichert. Die Wärme wird in den Weltraum abgestrahlt. Ist der Boden auch nur geringfügig wärmer als die Atmosphäre erwärmt er sich auch nicht weiter. Tagsüber erwärmt sich der Boden wieder durch die Sonne und sind die Wolken wieder da, sinkt die Temperatur nachts nur gering. Am CO2-Gehalt hat sich in der Zwischenzeit absolut nichts geändert. Die Wolken (aus Wasserdampf) reduzieren aber die Abstrahlung in den Weltraum.
Die Venus hat hingegen die gesamte Zeit Wolken und Dunstschichten, die einen Teil der Sonnenstrahlung absorbieren.
Deshalb widerspricht es auch meinem Bauchgefühl, dass die Venus bei fehlenden Wolken (nur durch das CO2) noch wärmer wäre. Dann wäre die Wärmeabstrahlung in den Weltraum größer. Nur zu der Zeit und dort wo die Oberfläche von der Sonne getroffen wird, würde es wärmer.
Ein Vergleich der Erde mit der Sonne ist unpassend.
Auch die Biosphäre sorgt für eine dämpfende negative Rückkopplung. Die Pflanzendecke der Kontinente gedeiht in einer warmen und feuchten Atmosphäre üppiger, entzieht damit der Atmosphäre mehr CO2 und stabilisiert dadurch die Erwärmung. Diese negative Rückkopplung funktioniert auch in einer Kaltzeit, in der die Pflanzendecke schütterer ist und somit mehr CO2 in der Atmosphäre bleibt – ein Effekt, der als ein selbstverstärkender Faktor bei den Enteisungsphasen einer Kaltzeit mitwirken dürfte.
Besonders stark hat sich die Rückkopplung über die Pflanzendecke in der Zeit ausgewirkt, als im späten Silur bis zum frühen Karbon (vor ca. 400–350 Millionen Jahre) die Biosphäre die Kontinente eroberte. Die neue Pflanzendecke der Kontinente reduzierte den CO2-Gehalt drastisch vom mehr als dem 10-Fachen des heutigen auf mit heute vergleichbare Werte.
Dies führte an der Wende vom Karbon zum Perm – zusammen mit der damals noch um 2–3 % weniger intensiv strahlenden Sonne – vor rund 300 Mio. Jahren zum ausgeprägten permo-karbonen Eiszeitalter.
Lieber Herr Sander, #20
„Berücksichtigt man nur diese Faktoren hat das CO2 wohl kaum einen Einfluss [auf die Venus-Atmosphäre]. Oder sehe ich das falsch?“
Ja, folgt man der Fachliteratur sehen Sie das falsch. Kann man auch erfahren, wie Sie durch welche Berücksichtigung zu dieser Schlußfolgerung kommen? Oder war Ihr Bauchgefühl schon alles an Argumentation?
@ #16: Sepp Trütsch sagt am Montag, 19.08.2013, 13:02
„Jede duchmischte Gasatmosphäre weist einen Temperaturgradienten auf – und der ist abhängig von der Dichte des Gases.“
Eine gut „duchmischte Gasatmosphäre“ existiert nur in der Troposphäre – aber Sie haben etwas Wesentliches vergessen: die Stratosphäre.
MfG
@ #18: S.Hader sagt am Montag, 19.08.2013, 19:12
„Deshalb gab es keinen Schutz mehr vor den geladenen Teilchen, dem Sonnenwind, welche immer weiter die Atmosphäre des Mars abgetragen hat.“
Danke für den Hinweis. Näheres dazu: http://tinyurl.com/SonnWin
Das Abtragen geschieht ja durch das Wechselspiel Einfangen des abgebremsten Sonnenwindes und Wegfliegen beschleunigter Marsluft. Wegen geringer Gravitation überwiegt das Wegfliegen.
Mir ging es nur darum, zu zeigen, daß auf Sonne, Venus, Erde, Mars die gleichen physikalischen Gesetze gelten, was unterschwellig immer wegen der unterschiedlichen Oberflächentemperaturen bezweifelt wird. Die unterschiedlichen gegenwärtigen Oberflächentemperaturen folgen ganz zwangsläufig hauptsächlich aus den unterschiedlichen Massen und nur wenig aus den unterschiedlichen Konzentrationen.
MfG
Lieber Herr Ebel, #23
zum radiativen-konvektiven Zustand der Venus-Troposphäre aufgrund der radiativen Instabilität (Schwarzschild-Kriterium) wäre ich schon noch gekommen.
Gestern wurde in den Medien eine neue CO2-Horror-Kampagne gestartet:
„Studie: Europäische Wälder können bald kein CO2 mehr aufnehmen“ http://tinyurl.com/lz7h5hj
Der Begriff „CO2-Senken“ hier http://tinyurl.com/l6nr3j5 suggeriert Giftmüll für das lebensnotwendige CO2. Ein schönes Beispiel für die Technik der Propaganda.
@ #22: NicoBaecker sagt am Dienstag, 20.08.2013, 09:27
„wuerde ich vereinfacht mal die Strahlungstransportgl. fuer eine CO2 Atmosphaere mit Venusverhaeltnissen integrieren“
Das ist zu sehr vereinfacht. Die Strahlungstransportgleichungen liefern nur den Temperaturverlauf in der Stratosphäre. Der größte Teil des Temperaturverlaufs liegt aber in der Troposphäre und dort bestimmt die Adiabatik den Temperaturverlauf.
MfG
Lieber Herr Kohl,
fuer die Venus recherchieren Sie mal unter den Autoren Pollack, Grinspoonn, bullock, Referenzen fuer die logarithmosche Fitfunktion habe ich Ihnen bereits gegeben.
Wenn ich Sie richtig verstanden habe, wollen Sie eine Formel fuer die Abhaengigkeit der Venusbodentemperatur vom CO2 Gehalt? Eine solche Bezeihung laesst sich wahrscheinlich aus Klimamodellen fuer die Venus ableiten analog zur Erdatmsophaere.
wenn ich nun die Temperatur der Venus berechnen wollte, wuerde ich verinfacht mal die Strahlungstransportgl. fuer eine CO2 Atmosphaere mit Venusverhaeltnisse integrieren und ueber die Energiebilanz auf die notwendige Temperatur am Boden schliessen, die dieser Energiebilanz genuegt.