Hier zunächst die Zusammenfassung aus dem Bericht [1]:
Executive Summary : 10 Key Facts
(1) According to temperature records from the instrumental period (since about 1850), 2018 was one of the warmest years on record, but cooler than both 2016 and 2017.
(2) At the end of 2018, the average global air temperature is continuing a gradual descent towards the level characterising the years before the strong 2015-16 El-Niño episode. This underscores that the global surface temperature peak of 2015–16 was caused mainly by this Pacific oceanographic phenomenon. It also suggests that what has been termed ‘the temperature pause’, ‘hiatus’, or similar terms, may reestablish itself in the future.
(3) There still appears to be a systematic difference between average global air temperatures estimated by surfacestations and by satellites. Especially since 2003, the average global temperature estimate based on surface stations has deviated from the satellite-based estimate in a warm direction.
(4) The temperature variations recorded in the lower troposphere are generally reflected at higher altitudes also, and the overall temperature ‘pause’ since about 2002 is recorded at all altitudes, including the tropopause and into the stratosphere above. In the stratosphere, however, the temperature ‘pause’ had already commenced by around 1995; that is, 5–7 years before a similar temperature ‘pause’ began in the lower troposphere near the planet’s surface. The stratospheric temperature ‘pause’ has now lasted without interruption for about 24 years.
(5) The recent 2015-16 El Niño was among the strongest since the beginning of the record in 1950. Considering the entire record, however, recent variations between El Niño and La Niña episodes are not unusual.
(6) Since 2004, when the ARGO floats came into operation, the global oceans above 1900m depth have on average warmed somewhat. The maximum warming (between the surface and 120m depth) mainly affects oceans near the equator, where the incoming solar radiation is at a maximum. In contrast, net cooling has been pronounced for the North Atlantic since 2004.
(7) Data from tide gauges all over the world suggest an average global sea-level rise of 1- 1.5 mm/year, while the satellite record suggests a rise of about 3.2 mm/year. The large difference between the two data sets still has no broadly accepted explanation.
(8) Since 1979, Arctic and Antarctic sea ice extent have decreased and increased, respectively. Superimposed on these overall trends, however, variations of shorter duration are also important. In the Arctic, a 5.3-year periodic variation is important, while for the Antarctic a variation of about 4.5-years’ duration is seen. Both these cycles reached their minima simultaneously in 2016, which explains the simultaneous minimum in global sea ice extent. A new phase, with development towards larger ice extent in both hemispheres, may now have begun.
(9) The Northern Hemisphere snow cover extent has undergone important local and regional variations from year to year. The overall global tendency since 1972, however, is for overall stable snow extent.
(10) Tropical storm and Hurricane Accumulated Cyclone Energy (ACE) values since 1970 have displayed large variations from year to year, but no overall trend towards either lower or higher activity. The same applies for the number of hurricane landfalls in the continental United States, for which the record begins in 1851.
======================================================
Diese umfassende und tiefgreifende Übersicht über das Klima-System wird illustriert durch zahlreiche Graphiken und Abbildungen.
Davon sei hier eine kleine(!) Auswahl präsentiert. Die Original-Graphiken wurden hier von uns zur Veranschaulichung durch einige Textfelder und sonstige kleine Erläuterungen ergänzt. Daher sind sie „selbst-erklärend“. Weitere „Ausführungen“ zu jeder Graphik findet man anschaulich und verständlich in der Originalarbeit [1].
—————————————————————————————————————-
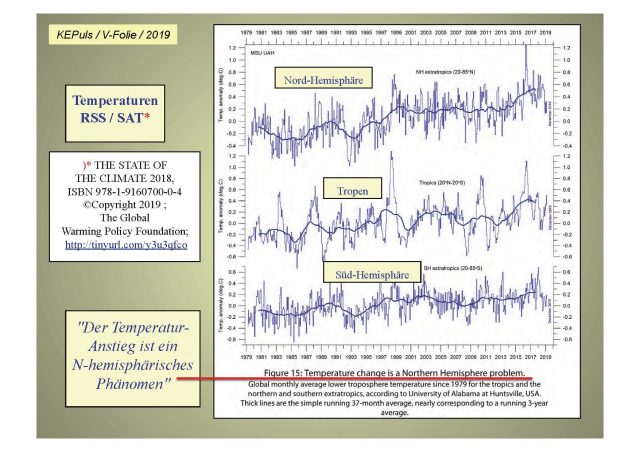
Luft – T e m p e r a t u r :
„At the end of 2018, the average global air temperature is continuing a gradual descent towards the level characterising the years before the strong 2015-16 El-Niño episode. This underscores that the global surface temperature peak of 2015–16 was caused mainly by this Pacific oceanographic phenomenon. It also suggests that what has been termed ‘the temperature pause’, ‘hiatus’, or similar terms, may reestablish itself in the future.“
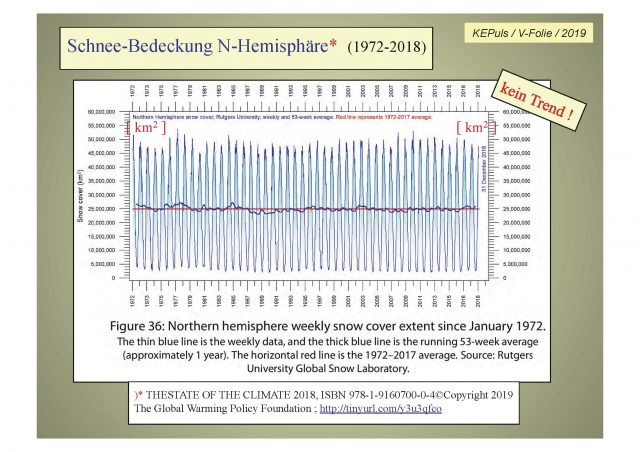
Schnee – Bedeckung : Kein Trend !
—————————————————————————————————————-
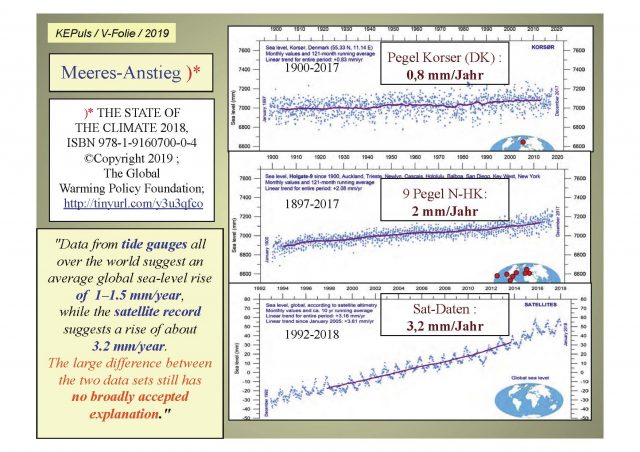
Meeres-Anstieg : Keine Beschleunigung, kein „CO2-Signal“ !
„Data from tide gaugesall over the world suggest an average global sea-level rise of 1–1.5 mm/year, while the satellite-derived record (Figure 30) suggests a rise of 3,2 mm/year, or more. The noticeable difference (at least 1:2) between the two data sets has no broadly accepted explanation.“
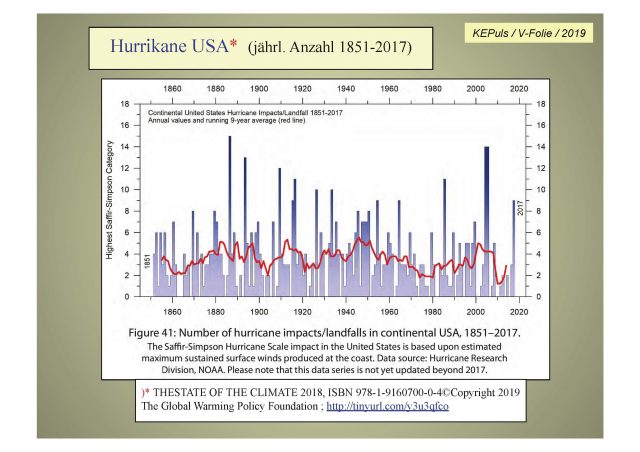
H u r r i k a n e : Kein Trend !
„The number of hurricane landfalls in the continental United States is shown in Figure 41. Over the observational period, this data series shows considerable variations from year to year, but it is not possible to detect any clear trend over time.“
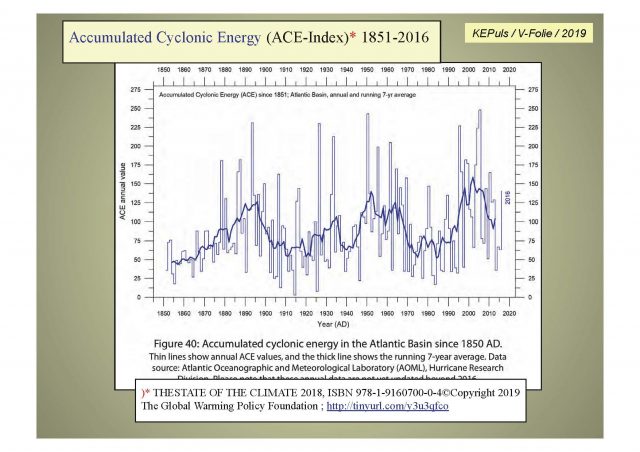
Accumulated Cyclone Energy (ACE) : Kein Trend !
„ACE is calculated as the square of the wind speed every 6 hours and is then scaled by a factor of 10,000 for usability, using a unit of 104 knots. The ACE of a season is the sum of the ACE for each storm and therefore represents the total hurricane activity.“
„The global ACE data display a variable pattern over time (Figure 38), but without any clear trend. The diagrams for the Northern and Southern Hemispheres (Figure 39) are similar in this respect.“
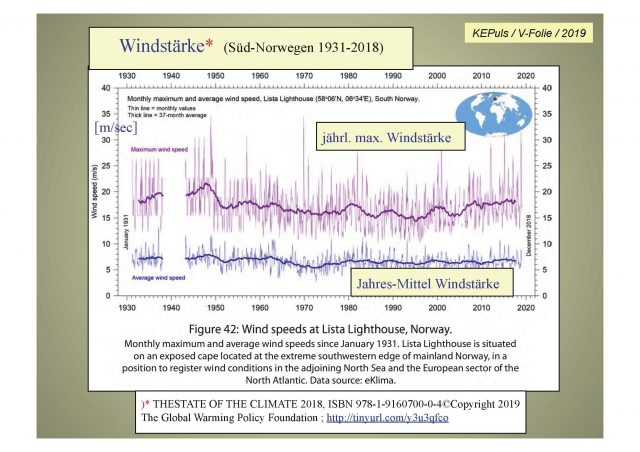
Wind an der Nordsee : Kein „CO2-Signal“ !
„One example from north-west Europe is Lista Lighthouse, which sits on an exposed cape at the extreme southwestern edge of the mainland of Norway. It is thus well suited to register wind conditions in the adjoining North Sea and the European sector of the North Atlantic.… The peak wind strengths were recorded shortly after World War II, and strengths have since declined somewhat.“
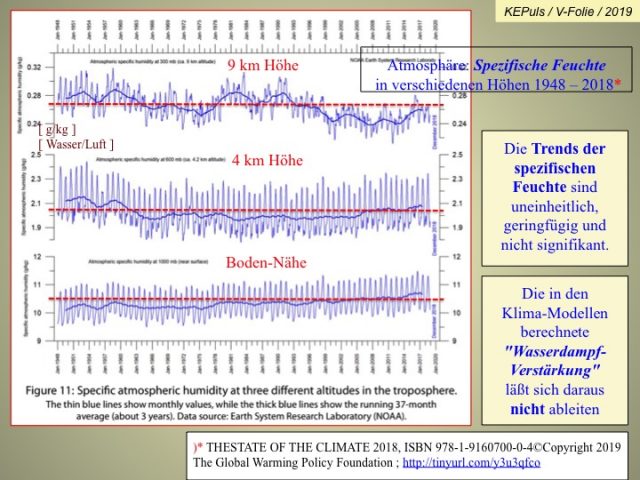
Luft-Feuchte [g/kg] :
Es gibt keinen einheitlichen Trend – weder in den Höhenstufen noch auf der Zeitachse.
————————————————————————————————————————————–
F a z i t :
Wie kann irgend jemand aus dieser nahezu lückenlosen Übersicht in der ausführlichen Originalarbeit [1] zum Sachstand und den Trends der Klimadaten
eine „CO2-Klima-Katastrophe“ ableiten ? RÄTSELHAFT !
Das bleibt das Geheimnis der Klima-Alarmisten und der ihnen ergebenen Politiker und Medien !
============================================================
Q u e l l e :
[1] THE STATE OF THE CLIMATE 2018; ISBN 978-1-9160700-0-4©Copyright 2019;
The Global Warming Policy Foundation, GWPF-Report 34 ; http://tinyurl.com/y3u3qfco
============================================================
A n m e r k u n g EIKE:
Der vorstehende Beitrag kann in besserer Bild-Qualität hier als PDF runter geladen werden :
ENGLISCH: Puls.Tx.kpl
DEUTSCH: Puls.19.K-StatusBer2018.19.kpl.D


Wir freuen uns über Ihren Kommentar, bitten aber folgende Regeln zu beachten:
- Bitte geben Sie Ihren Namen an (Benutzerprofil) - Kommentare "von anonym" werden gelöscht.
- Vermeiden Sie Allgemeinplätze, Beleidigungen oder Fäkal- Sprache, es sei denn, dass sie in einem notwendigen Zitat enthalten oder für die Anmerkung wichtig sind. Vermeiden Sie Schmähreden, andauernde Wiederholungen und jede Form von Mißachtung von Gegnern. Auch lange Präsentationen von Amateur-Theorien bitten wir zu vermeiden.
- Bleiben Sie beim Thema des zu kommentierenden Beitrags. Gehen Sie in Diskussionen mit Bloggern anderer Meinung auf deren Argumente ein und weichen Sie nicht durch Eröffnen laufend neuer Themen aus. Beschränken Sie sich auf eine zumutbare Anzahl von Kommentaren pro Zeit. Versuchte Majorisierung unseres Kommentarblogs, wie z.B. durch extrem häufiges Posten, permanente Wiederholungen etc. (Forentrolle) wird von uns mit Sperren beantwortet.
- Sie können anderer Meinung sein, aber vermeiden Sie persönliche Angriffe.
- Drohungen werden ernst genommen und ggf. an die Strafverfolgungsbehörden weitergegeben.
- Spam und Werbung sind im Kommentarbereich nicht erlaubt.
Diese Richtlinien sind sehr allgemein und können nicht jede mögliche Situation abdecken. Nehmen Sie deshalb bitte nicht an, dass das EIKE Management mit Ihnen übereinstimmt oder sonst Ihre Anmerkungen gutheißt. Wir behalten uns jederzeit das Recht vor, Anmerkungen zu filtern oder zu löschen oder zu bestreiten und dies ganz allein nach unserem Gutdünken. Wenn Sie finden, dass Ihre Anmerkung unpassend gefiltert wurde, schicken Sie uns bitte eine Mail über "Über Uns->Kontakt"„ Es wär schön, dazu hier auf Eike mal etwas von einem Glaziologen zu lesen.“
Untenstehende Links untersuchen die Vergangenheit der Alpengletscher.
http://www.alpinfo.ch/fileadmin/user_upload/alpinfoch/Forschung/Projekte/Klimaentwicklung/Die_Alpen_6-2004.pdf
Aletschgletscher
http://www.ngbe.ch/wordpress/wp-content/uploads/2014/08/Hanspeter-Holzhauser.pdf
http://www.geo.uzh.ch/~snus/publications/nussbaumer_et_al_2011b.pdf
Die Erde unterliegt den natürlichen Einflüssen in der Vergangenheit, jetzt und in Zukunft. (Desshalb ist die Vergangenheit für die Voraussage so wichtig.) Natürliche Einflüsse werden nach meiner Kenntnis in den IPCC Modellen kaum einbezogen. (Das IPCC wurde ja meines Wissens gegründet um ausschliesslich den menschengemachten Einfluss zu bestätigen, für alles andere hat man „… kein Mandat“ sprich „wird man nicht bezahlt“.)
Sehr geehrter Herr Ziegler: Warum sagen Sie „nach Ihrer Kenntnis“ und „nach Ihrem Wissen“? Haben Sie jemals einen IPCC Bericht gelesen? Da ist selbstverständlich ausführlichst von den natürlichen Faktoren die Rede, die das Klima maßgeblich beeinflussen. Das Kondensat aus den vom IPCC gesammelten wissenschaftlichen Arbeiten ist dabei, dass es für die aktuell beobachtete Erwärmung der Erdatmosphäre und der Ozeane KEINE zufriedenstellende Erklärung gibt, die alleine die natürlichen Ursachen berücksichtigt; denn einige der wichtigen natürlichen Faktoren wie die Erdbahn-Parameter und die Aktivität der Sonne sollten eher eine Abkühlung als eine Erwärmung bedingen. Das führt zu dem Indizien-Prozess, der CO2 als Täter überführt. Vor einem Strafgericht würde man C02 freisprechen müssen nach dem Grundsatz in dubio pro reo. Und Zweifel daran, in welchem Maße C02 das Klima tatsächlich beeinflusst, gibt es selbstverständlich auch in der „etablierten“ Wissenschaft. Steht auch in den IPCC-Berichten.
Aha!
Und weil nach dem IPPC eine Vorhersage unmöglich ist, alle Berechnungen für den Mülleimer sind und es so recht keine Erklärung gibt, nimmt man einfach das CO2.
Irgendetwas muss ja für Klimaschwankungen, die es zwar immer gegeben hat, in der heutigen Zeit zuständig sein. So wird ein Schuldiger für die Klimaschwankungen erzeugt: „Der Mensch“.
Die schwarzen Schafe in der Wissenschaft geben den Logen die gewünschte Macht, mit dem Argument „CO2“, alle Machenschaften zu legitimieren und die Politik zu manipulieren. Das können die dann weltweit durchsetzen, wobei der deutsche Michel besonders hingebungsvoll auf den Betrug hereinfällt.
Seit etwa 4.6 Milliarden Jahren ändert sich auch der Zustand des gegenwärtig (kurzzeitig) von Menschen besiedelten Lebensraumes. Daran wird sich („mit an Sicherheit grenzender Wahrscheinlichkeit“) auch bis zu seiner Verdampfung in etwa 5,4 Milliarden Jahren nichts ändern. Über diese Veränderungen kann man bekanntlich munter fabulieren!
Absolut sicher ist allerdings, dass die CO2 Menge in der Atmosphäre mit all diesen Änderungen nichts zu tun hat:
Eine angebliche Klimasensitivität des CO2 können nämlich die geliebten Modelle nur deshalb vortäuschen, weil niemand die dominante Wirkung der Wasser/Eis Aerosole mathematisch erfassen kann. Als Folge ignorieren die angeblichen (Spitzen“-) Wissenschaftler alle gemeinsam (!!!) , dass diese Aerosole die mengenabhängigen Veränderungen der unstreitigen Wirkung des CO2 gegenläufig (!!!) kompensieren. https://www.scribd.com/document/379087623/Das-CO2-ist-klimaneutral
https://de.scribd.com/document/372778420/Klimasensitivita-t-des-CO2-eine-Seifenblase
“ …. eine „CO2-Klima-Katastrophe“ ableiten ? RÄTSELHAFT !
Aus meiner Sicht kann man die Antwort u.a. in dem nachstehenden, heute erschienen Spiegel-Artikel finden. Für „läppische“ 15 Billionen € Investitionen soll demnach die Energieerzeugung zu über 80% auf alternative (der Ausdruck erneuerbare Energien geht nicht über meine Lippen) Energien umgestellt werden
https://www.spiegel.de/wirtschaft/unternehmen/oekostrom-koennte-2050-ueber-80-prozent-des-bedarfs-decken-a-1261923.html
Es geht nur um Macht und sehr sehr viel Geld – es muss ja nicht bei den 15 Billionen bleiben. Das ist im Prinzip das genialste Start-up, was es je gegeben hat. Das Geld wird über CO2 Zertifikate und zukünftig über CO2 Steuern kassiert – im Gegenteil, die Menschen sehnen sich direkt danach, Ihr Geld für diesen „guten Zweck“ abzugeben, je mehr desto besser.
Bevor es keine Bewusstseinsänderung bei den Menschen gibt, wird sich meiner Ansicht nach leider nichts ändern.
Darf man fragen, warum die Global Warming Policy Foundation glaubwürdiger sein soll als das Intergovernmental Panel on Climate Change?
Lieber Hr. Heinecke,
ganz einfach, weil das IPCC schon viel, viel öfter beim Schummeln erwischt wurde.
Mfg
😀
Vielen Dank für die Zusammenfassung.
Ich bin allerdings durch einen vorgeschlagenen Link auf den Artikel
„Klima-Skepsis erreicht auch die Deutschen Medien“ gelangt, der mich entsprechend hoffnungsvoll gestimmt hätte, wäre er nicht vom Januar 2013.
Danach, so zeigt es auch das widerwärtige und speichelleckende Verhalten der Obrigkeit wie der Medien, hat sich allerdings nicht mehr viel an aufgeklärter und objektiver Journallie gezeigt. Selbst die FDP (die nun wahrlich nicht zu meinen Favoriten gehören, knickt jetzt unter dem Schwert, das die Abweichler vom Mainstream bedroht, ein.
„Selbst die FDP (die nun wahrlich nicht zu meinen Favoriten gehören, knickt jetzt unter dem Schwert, das die Abweichler vom Mainstream bedroht, ein.“
Das komplette Altparteienlügengesindel muß weg!
AfD wählen
(oder was immer jemand glaubt wählen zu können/müssen. Aber auf keinen Fall SPDCDUCSUFDPGRÜNELINKE)
Ich geh ab jetzt wahrscheinlich gar nicht mehr wählen.
Mir reicht’s.
Die AfD ist mir zu rechts und zu neoliberal, und die anderen Parteien im BT unterstützen alle den Klima- und Energiewende-Irrsinn.
Ja Herr Guthmann, geht mir genau so.
Hinzu kommt bei der AFD:
„…Darum muss jedes Land, auch Deutschland, seinen Nato-Bündnisverpflichtungen nachkommen und mindestens zwei Prozent des Bruttoinlandsprodukts für die Verteidigung ausgeben – für die Sicherheit Europas und Deutschlands.“ – Georg Pazderski AFD
„…die anderen Parteien im BT unterstützen alle den Klima- und Energiewende-Irrsinn.“
Dann wählen Sie halt eine Partei, die nicht im Bundestag vertreten ist UND den gazen Quatsch NICHT unterstützt!
@besso Keks – Ich hatte eine Ein-Themen-Kleinpartei zuletzt gewählt, eben weil die AfD für mich nicht in Frage kommt und alle anderen Parteien im BT auch nicht – und weil ich von dem Thema dieser Partei auch überzeugt bin – aber wie sich für mich nun herausstellte: besagte Ein-Themen-Partei unterstützt offenbar auch „Fridays for Future“.
Ich habe echt die Schnauze voll.
Ich bleib bei der nächsten Wahl daheim.
Zu Rechts?
Gauland:Holte Bootsflüchtlinge nach D. als sie alle Parteien ablehnten.
Weidel:Homosexuell,lebt mit einer Singhalesin zusammen.
Es gibt Juden,Schwarze,Pakistaner,Jesiden,Christen,Atheisten in der Partei und viele sind mit Ausländern verheiratet.
Wenn das heute zu Rechts ist,was ist ihnen dann nicht zu Rechts?
Nichtwählen ist eine schlechte Lösung. Sie stärkt die Parteien, die für den Klima- und Energiewendeunsinn verantwortlich sind.
Also, die AfD zu wählen verbietet sich mir schon alleine wegen einiger Gestalten, mit denen ich ums Verplatzen nicht einer Meinung sein kann.
Ich muß allerdings gestehen, daß der eine oder andere Standpunkt nicht verkehrt ist. Aber das reicht nicht.
Vielleicht hilft ja das !
https://www.decision-making-confidence.com/how-to-evaluate-a-decision.html
Danke Herr Puls für die Zusammenfassung.
Temperaturwandel ist ein Problem der Nordhalbkugel. Richtig, bei der deutschen Wettertation Neumayer am Südpol gibt es keine Erwärmung seitdem es die Station gibt. Das Problem auf der Nordhalbkugel heißt zunehmender Wärmeinseleffekt bei den Wetterstationen. Stelle man die Stationen wieder an die kalten Flecke zurück wo sie vor über 100 Jahren standen, dann wäre die gemessene Erwärmung vorbei. Aber diese kalten Stellen gibts nicht mehr. Unbeheizte, einsame Klöster, Forsthäuser am Waldrand, bei den Fischteichen usw. Die ländlichen Stationen stehen heute bei Flughafen und neuerdings wie in Bremen und Straubing auf dem beheizten Dach des Towers oder anderen Gebäuden. Dazu kommt die Überarbeitung der STatistik, der DWD hat die Märztemperaturen seiner Wetterstationen im Zeitraum von 1881 bis 1961 um je ein Zehntel oder 2-Zentel nach unten gesenkt. Ich muss das wissen, denn ich habe eine Kopie der DWD-Statistik von 2012. Herr Puls verfügt über ähnliche Beweise. Ältere Messungen nach unten korrigieren und neue nach oben, das hilft auch beim Hohenpeißenberg. Im Falle des HPB ist mir der Betreffende sogar namentlich bekannt. Nun gut, das ändert die Trendlinie kaum. Nur muss man wissen, dass es sich bei Temperaturmessungen über Jahrzehnte nicht um wissenschaftlich gesicherte Erhebungen handelt. Die Märzenveilchen wissen das längst und blühen Ende März wie zu Mozarts und Goethes Zeiten, ab 500 m Meereshöhe und außerhalb der Ortschaften erst jetzt.
Sehr geehrter Herr Kowatsch, Sie brauchen keine Wärmeinsel, um die unterschiedlichen Entwicklungen bei den Temperaturen zu erklären, da genügen zwei Weltkarten: Die Südhalbkugel besteht zum allergrößten Teil aus Ozeanen, mittendrin Antarktika. Im Gegensatz dazu dominiert auf der Nordhalbkugel das Festland. Die Temperaturträgheit großer Wassermassen dürfte ja geläufig sein. Deshalb waren die Kaltphasen im aktuellen Eiszeitalter ebenfalls ein Phänomen, das vor allem die Nordhalbkugel dramatisch verändert hat. Noch eins, ich wiederhole mich: Wie bringen Sie die von Ihnen postulierte Abkühlung in Mitteleuropa mit dem Schmelzen der Alpengletscher in Einklang? Es wär schön, dazu hier auf Eike mal etwas von einem Glaziologen zu lesen.
Guten Tag Herr Heinecke,
hier eine umfassende Studie für die Region Tirol: https://www.zukunft-skisport.at/site/assets/files/1019/studie_tirol_forum-zukunft-skisport_nov2018.pdf
Klar wird, dass die Gletscherschmelze ihre Ursache in den sich erwärmenden Sommermonaten hat. Ursächlich hierfür ist auch eine deutliche Zuname der Sonnenscheindauer ( seit den 70igern immerhin +25% ).
Die Winter haben sich in Tirol in den letzten 50 Jahren nicht erwärmt und werden seit 30 Jahren sogar wieder kälter ( – 1.3 Grad ).
Unterm Strich ist die Erwärung im Sommer größer als die Abkühlung im Winter ( -> optimal für den Toursimus ), so dass sich die Gletscher aus diesem Grund – neben anderen Faktoren – zurückziehen. Kann aber morgen schon wieder andersrum sein…..
Eine Katastrophe ist es jedenfalls nicht !
Sehr geehrter Herr Heinecke,
ich könnte mir vorstellen, dass die Masse des Eises von verschiedenen Faktoren/Einwirkungen abhängt:
(Abgesehen davon, dass die Erde nur ein kleiner Punkt im Sonnensystem/im Universum ist)
– Stärke und Dauer der Bewölkung (Sonnenscheindauer und Intensität);
– Windrichtung und Windstärke;
– Luftfeuchtigkeit;
– Temperatur;
– div. langfristige Zyklen.
Experten werden viel darüber zu sagen haben.
So wie Sie die Frage stellen, gehe ich davon aus, dass Sie eine ganz plausible Lösung im Ärmel haben – das CO2.
Herr Kowatsch möge mir verzeihen. 🙂
Sehr geehrter Herr Bühner, weder habe ich eine Lösung im Ärmel noch heißt die CO2, und ich halte mich auch weder für einen Wetter- noch für einen Klimaexperten, noch weniger meine ich, dass die extremen Verhältnisse im Alpenraum als Blaupause für Klima/Klimaveränderungen insgesamt dienen. Ich kenne die Alpen aus persönlicher Erfahrung von 40 Jahren Berg- und Gletschertouren sehr gut, und da ich nicht immer nur als normaler Tourist unterwegs bin, habe ich auch sehr engen Kontakt zu sehr sehr vielen Wissenschaftlern unterschiedlichster Disziplinen, die sich eingehend und sorgfältig mit der Veränderung des Klimas in den Alpen und mit dem Wachsen und Schrumpfen der Gletscher beschäftigen. Tatsächlich kann ein Gletscher wachsen, wenn es wärmer wird – weil mehr Schnee fällt. Umgekehrt kann er schrumpfen, wenn die Temperaturen fallen, eine Hochdruck-Dominanz ihm aber den Nachschub im Nährgebiet raubt. Gletscher schaffen sich ihr eigenes Klima, ich kenne sogar Schneebrücken in Tirol und Südtirol, die jeden heißen Sommer überstehen. Ich weiß (als Laie) sehr wohl, dass es unendlich viele Faktoren gibt, die auf das Klima wirken, ich weiß, das die Sonne der mit großem Abstand wichtigste Klimafaktor ist, aber ich bin auch überzeugt, dass das C02 ebenfalls ein Klimafaktor ist – wie auch die Autoren der in einem anderen Kommentar erwährten Tirol-Studie betonen. Ich maße mir allerdings nicht an, die gesamte Komplexität des Klimageschehens zu durchschauen, und noch weniger meine ich, dass es einfache Antworten gibt. Über allem aber steht für mich der Respekt gegenüber fundierter wissenschaftlicher Arbeit (was nicht heißt, dass Wissenschaftler keine Fehler machen, ganz im Gegenteil. Fehler bringen die Wissenschaft voran.) Es ist dieser Respekt, den viele Beiträge hier auf Eike vermissen lassen.
Sehr geehrter Herr Heinecke, ich sehe das erst jetzt.
„… weder habe ich eine Lösung im Ärmel noch heißt die CO2 …“.
Und: „… aber ich bin auch überzeugt, dass das C02 ebenfalls ein Klimafaktor ist …“.
Also doch!???
Und: „Es ist dieser Respekt, den viele Beiträge hier auf Eike vermissen lassen.“
Welchen Respekt?
Den Respekt vor Betrügern?
Werter Herr Heinicke,
die Nordhalbkugel besitzt 39% Landmasse und 61% Meeresfläche. Man kann also nicht, wie Sie behaupten, von einer Dominanz der Landmasse sprechen. Sehr wohl weiß ich, dass die Landmasse auf der Südhalbkugel nur 19% beträgt. Vielmehr , denke ich, sollte man den Einfluß der Meeresströmungen (vor allem Golfstrom) berücksichtigen, da dadurch eine größere Wärmemenge von Süd nach Nord als umgekehrt transportiert wird.
Sehr geehrter Herr Gruhn, Sie haben Recht. „Dominanz“ war der falsche Ausdruck.
Was die seit vielen Jahrzehnten vergleichbaren Wetterstationen (ohne zivilisatorische Verfälschung) anbelangt, so hat Herr Dr. Hager auf HAGER-meteo.de zwei davon bis 2017 penibelst dokumentiert. Sie zeigen eher eine leichte Abkühlungstendenz.